IAAC Student Guide: Where to live in Barcelona?
Deciding to live abroad is an overwhelming resolution. Along with all the stress of gathering documents and organizing the moving, if you don’t know a city enough, it can be very rough to get around it and especially to find out what’s the best place for you to live. In my personal experience of moving to Barcelona, it took me quite some time to discover the right neighbourhood to live because it had to be within my budget and not far from the university. Therefore, the idea of this project was to provide prospective IAAC students with an analysis of the average rent price in Barcelona’s neighbourhoods and the availability of places for rent in them, relating this information to their distance to the university’s main building, in order to help students decide on which neighbourhoods they should start looking for a home.

Methodology for data gathering
To start this analysis, I began by downloading the shapefiles of the city of Barcelona and its neighbourhoods on Carto BCN. From these shapefiles, using the software Qgis, I was able to extract the neighbourhoods’ centroids and export their coordinates as a csv file, in order to use these center points for displaying the rent information of one each of them.
The information about rent in Barcelona’s neighbourhoods’ was available on the website Open Data BCN. For the average rent price, I got a csv file containing the values of 2020. It is clear that students don’t usually rent a whole apartment for themselves, but information about specific rent price of rooms wasn’t available, thus I used the existing data, which gives an idea of how much 2 or 3 students would pay for renting a whole apartment. On the other hand, the data on number of current places for rent was also not available, however the website provides a csv file with registered contracts of places for rent in each neighbourhood of the city, and after analysing the values from the past 5 years I could notice that they don’t vary much. Therefore, I used the registered contracts of places for rent in 2020 to represent the amount of places that were previously available on this year.
Lastly, I combined the csv file of the coordinates of neighbourhoods that I had created with the csv files of number of places for rent and average price and this was the csv file used for the analysis.
Grasshopper analysis
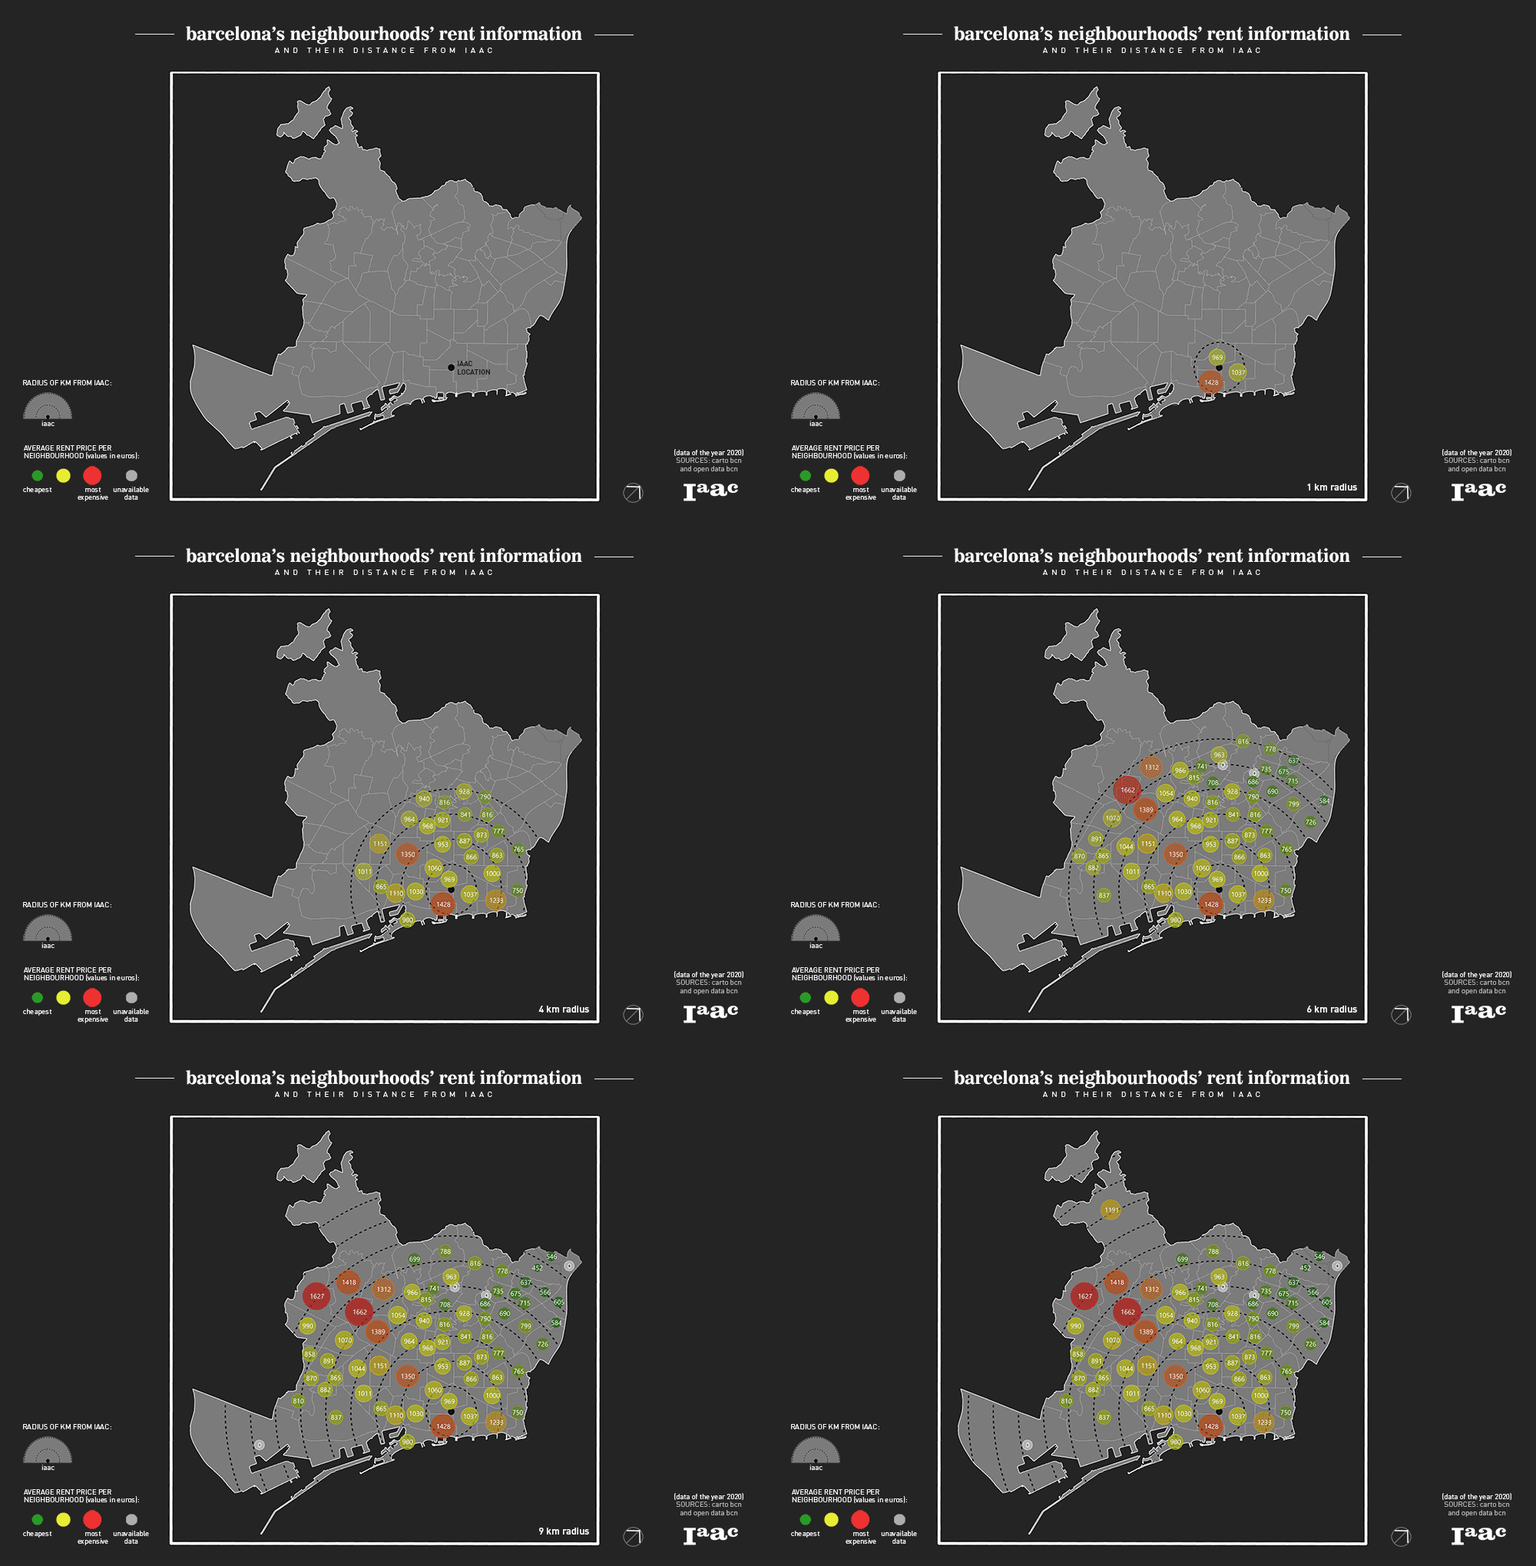
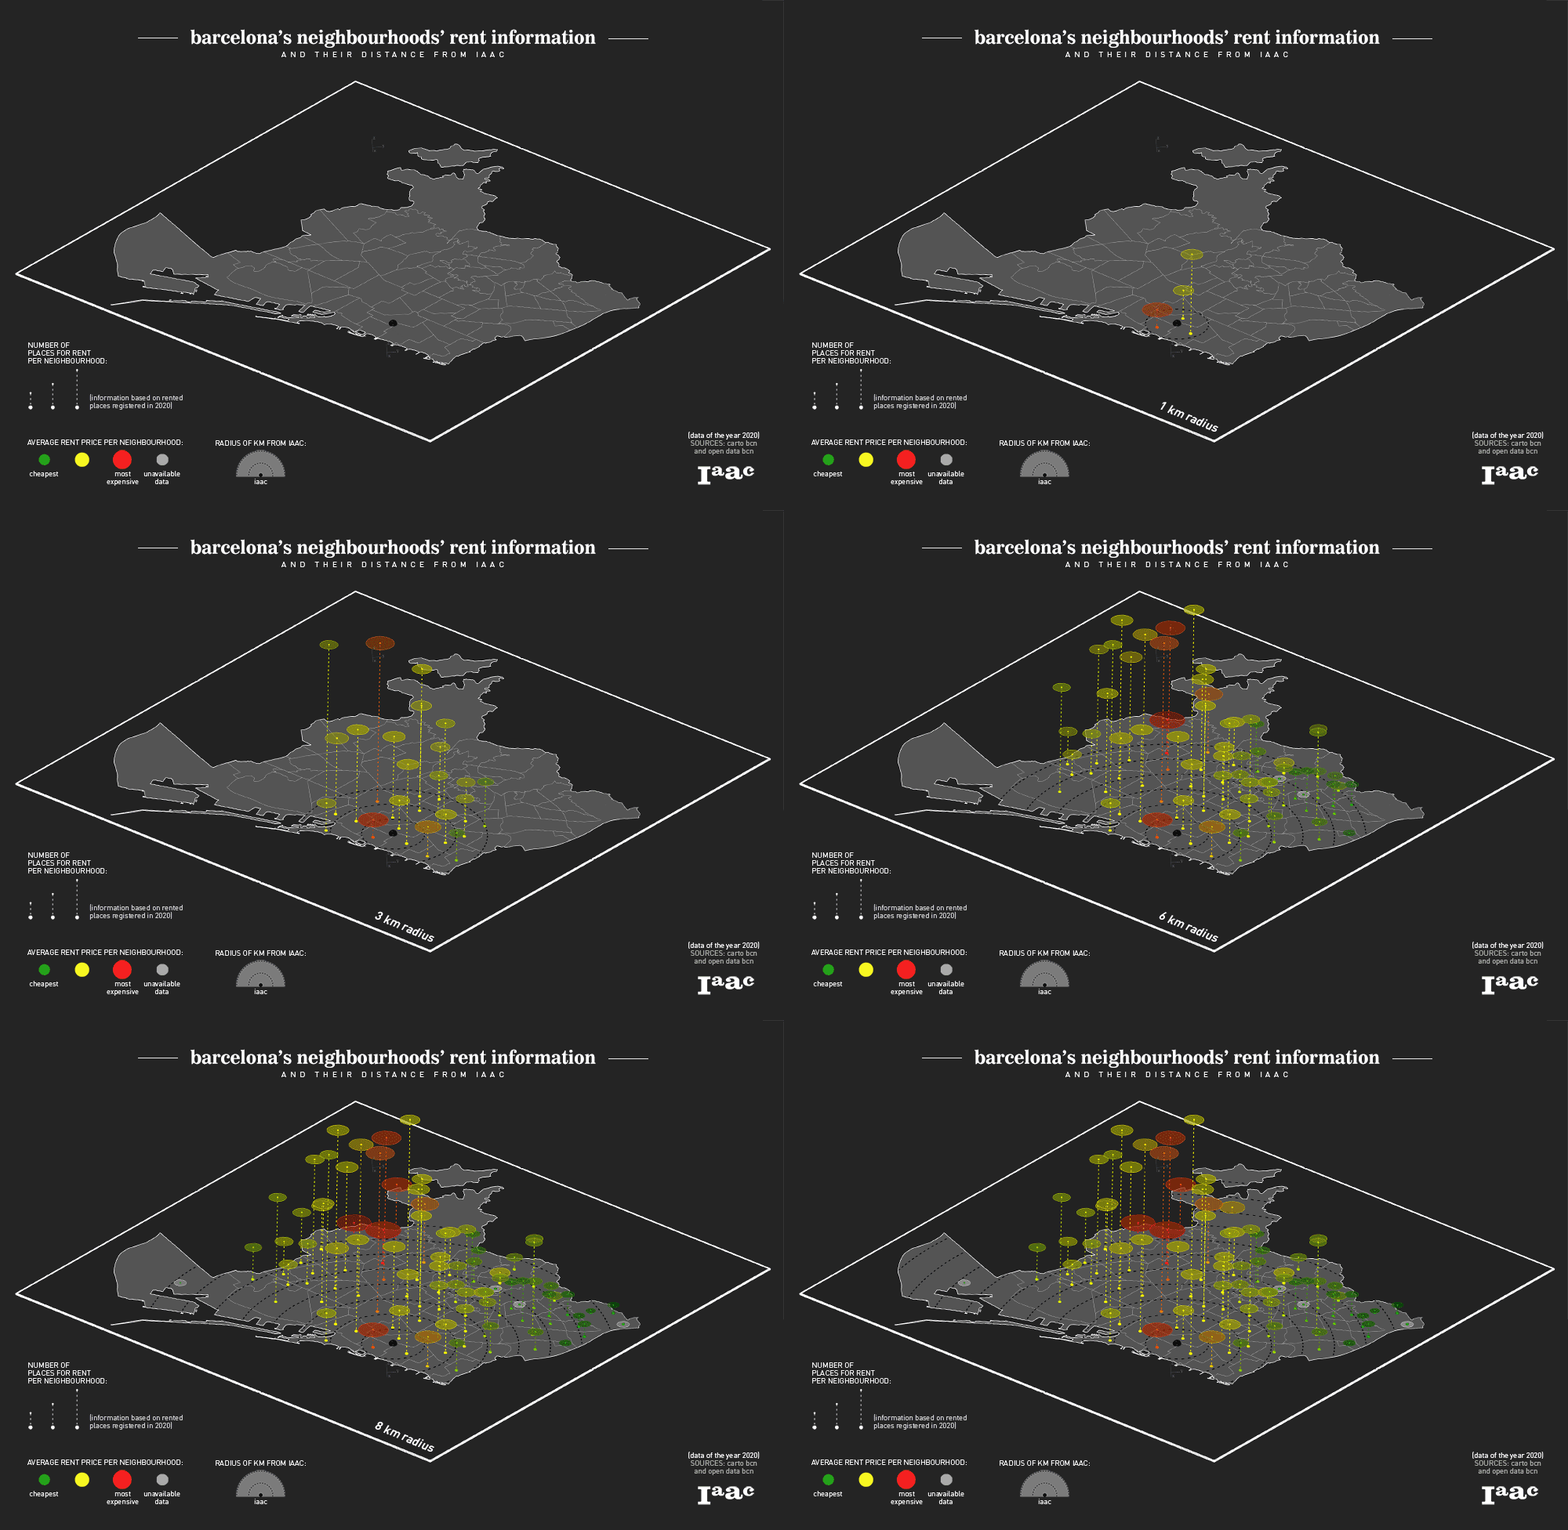
On Grasshopper, from the shapefiles, I was able to construct the neighbourhoods’ surfaces for the map. From the point constructed with IAAC’s coordinates, I defined multiple radius of distances from the building – on a scale of 1km – which I used as the parameter to show or not the neighbourhoods’ centroids. Therefore, I could input the rent data on the centroids, and they would only appear once I was showing the radius in which they are located. This way, I was able to create video animations showing the options on a 1km radius, 2km, 3km, and so on and so forth.
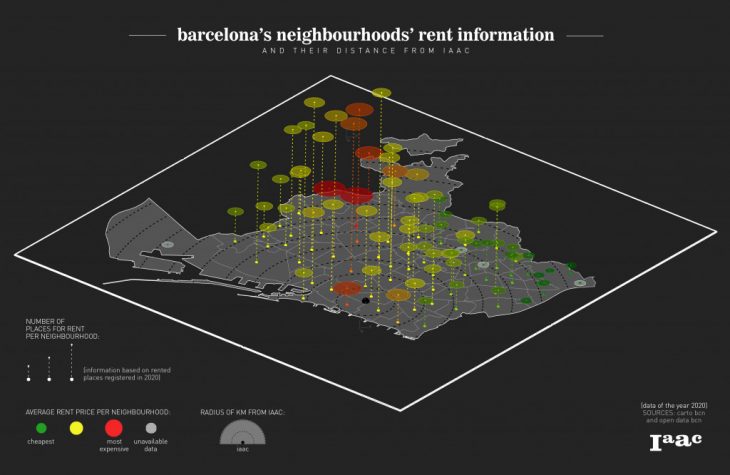
The csv file provided this rent data, and from each List Item I could get one of the information to be previewed in different ways: the number of places for rent was represented by different heights of lines on the isometric map, whereas the price was shown in circles with different radius on top of these lines as well as in the colours of the whole information presented – a scale from green to red, with green being the cheapest and red being the most expensive.

Video animation – Barcelona’s neighbourhoods rent information and their distance from IAAC

Video animation on isometric map
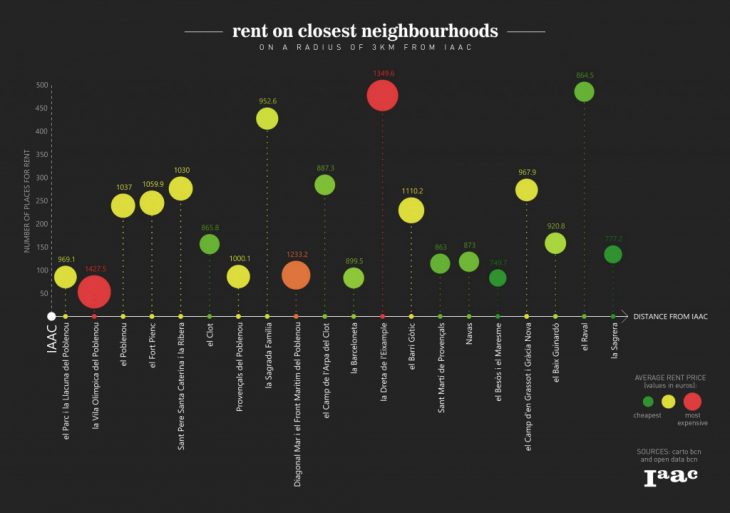
For the graph, the same information was displayed with the same graphics, only this time I used the distance from IAAC to order the neighbourhoods, showing from the closest to the most distant one, only on a radius of 3km from the university’s building.

Rent on closest neighbourhoods on a radius of 3km from IAAC
IAAC Student Guide: Where to live in Barcelona? is a project of IAAC, Institute for Advanced Architecture of Catalonia developed at Master in City & Technology in 2020/21 by student: Laura Guimarães, and faculty: Eugenio Bettucchi & Iacopo Neri.
