
The purpose of this environmental analysis is to enhance the final form of an office tower in London based on environmental performance and daylight access to minimize energy consumption and maximize indirect sunlight to the floors. The digital environmental tools used would be: ladybug, honeybee, and InfraReD.
In the City of London, the summers are short, comfortable, and partly cloudy and the winters are long, very cold, windy, and mostly cloudy.
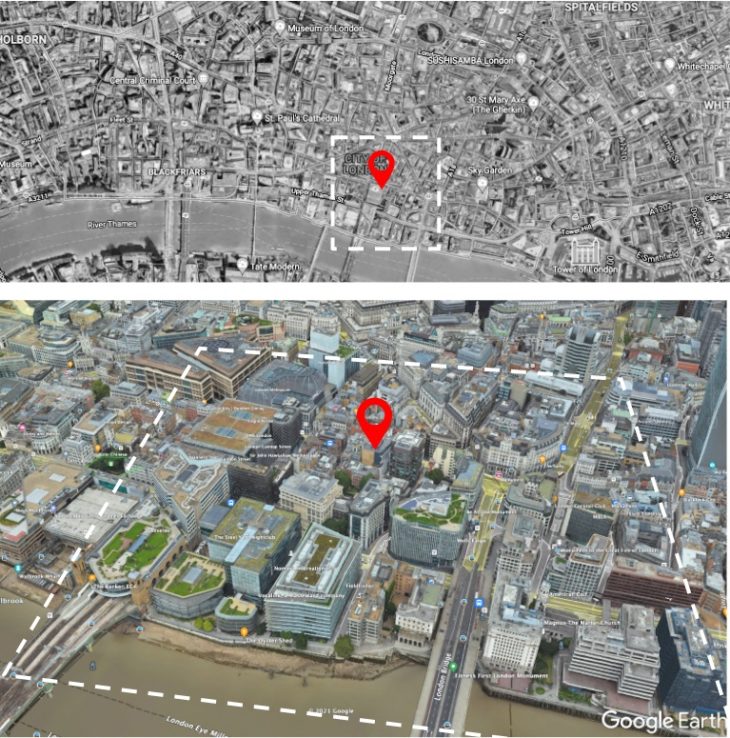
THE SITE// London
Square Mile-LONDON
500 X 500 meters
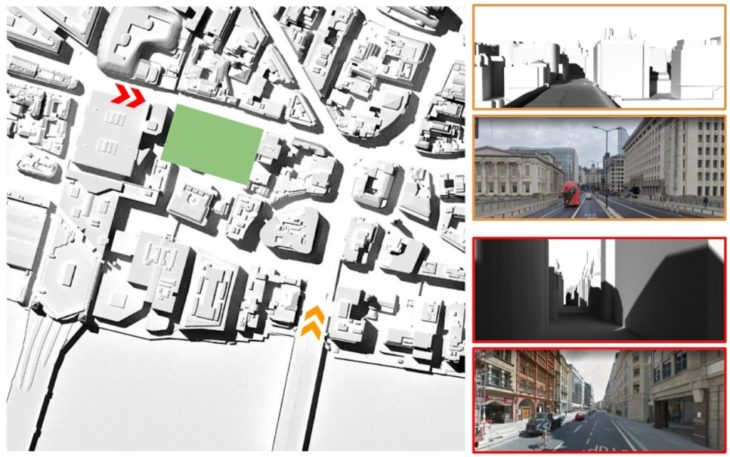
THE CONTEXT// Street view
The area is very common by its high density of commuting; workers and visitors at day time.
LOCAL CLIMATIC
AIR TEMPERATURE
Basic climatic charting/ Hourly
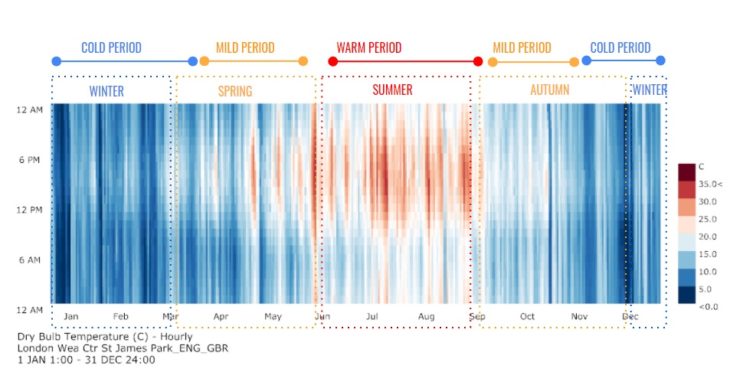 The warm period lasts for 3 months, from June to the end of September, with an average daily high temperature above 20°C. The hottest month of the year is July, with an average high of 25°C and a low of 15°C.
The cold period lasts for 4 months, from November to the end of March, with an average daily high temperature below 11°C. The coldest month of the year is December, with an average low of 0°C and a high of 10°C.
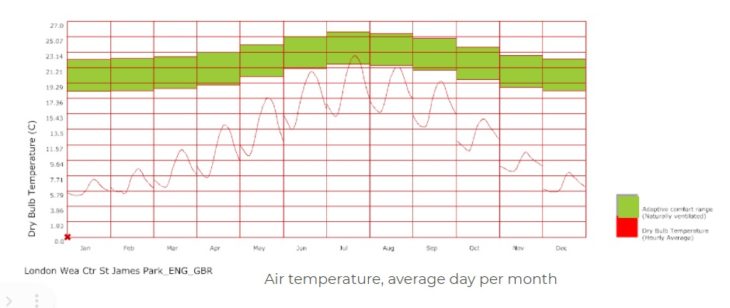
Air temperature, average day per month.

Air temperature, average monthly
RELATIVE HUMIDITY
Basic climatic charting/ Hourly
The humidity level in London does not vary significantly over the course of the year, remaining a virtually constant dry except the period between March to end of August the humidity rise up to around 10% especially in the afternoons.
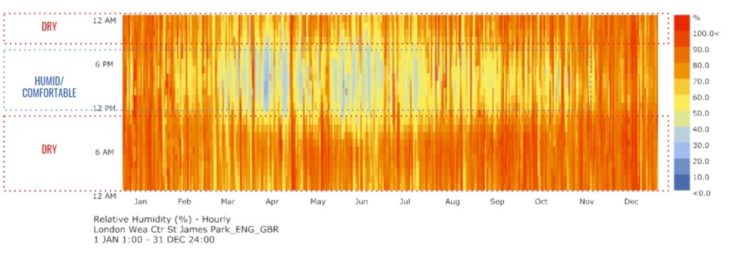
Relative Humidity, Hourly
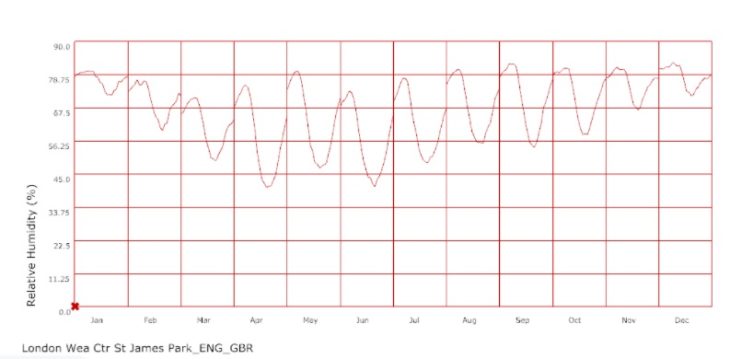
Air temperature, average day per month

Humidity, average monthly
WIND SPEED
Basic climatic charting/ Hourly
The windier months are from the end of October to the end of April. The windiest months of the year is January and December.
The calmer months are from May to October, The calmest month of the year is July.
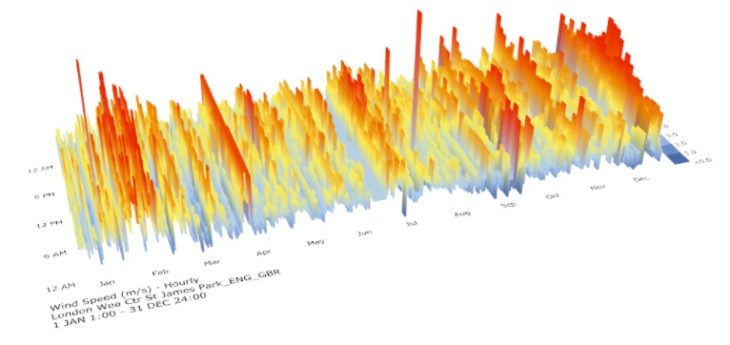
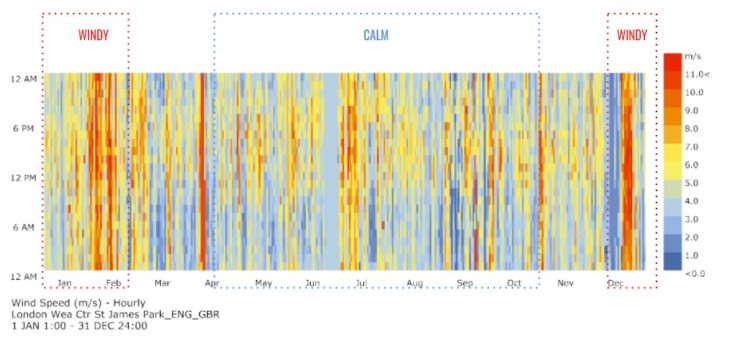
Wind speed- Hourly
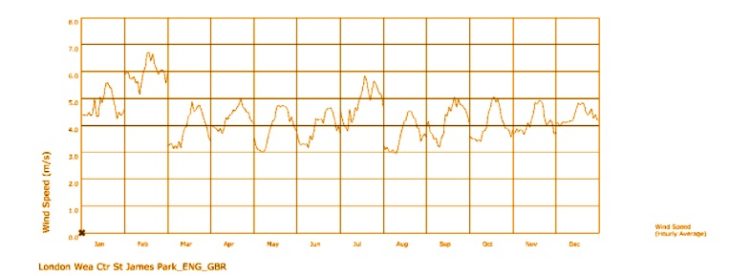
Wind speed, average day per month

Wind speed, average monthly
SOLAR RADIATION
DIRECT NORMAL RADIATION
Direct Radiation is the highest in the summer months between May and September.
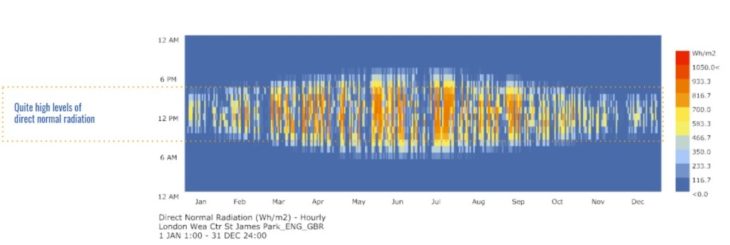
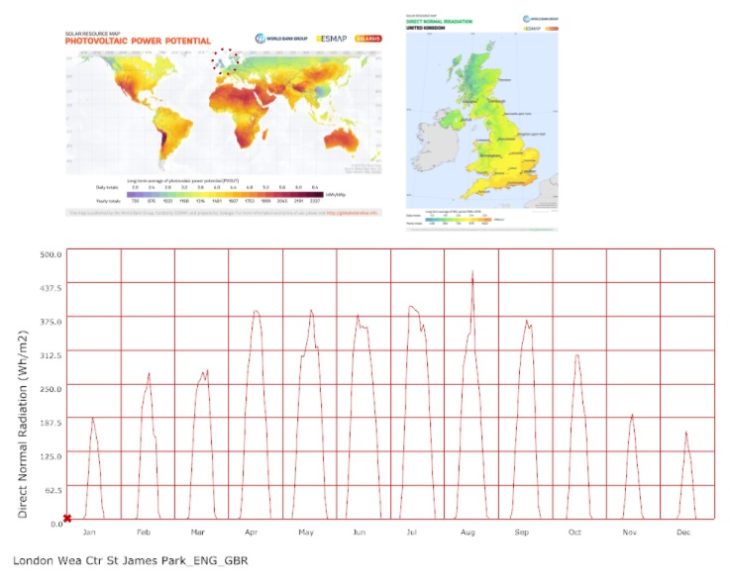
Direct Normal Radiation

DIFFUSE RADIATION
Diffuse Horizontal Radiation is almost nonexistent during the winters, while higher periods in May, June, a July in Summer
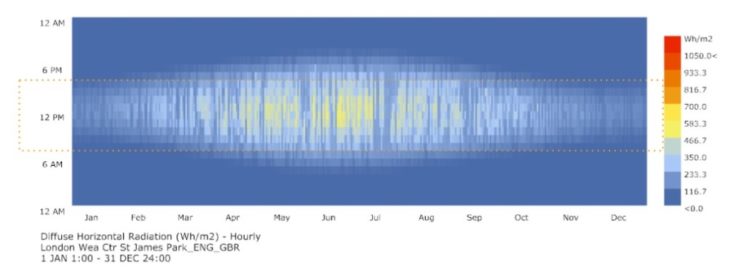
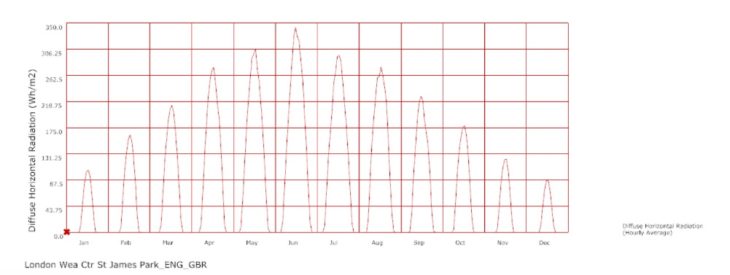
Diffuse Horizontal Radiation

GLOBAL RADIATION
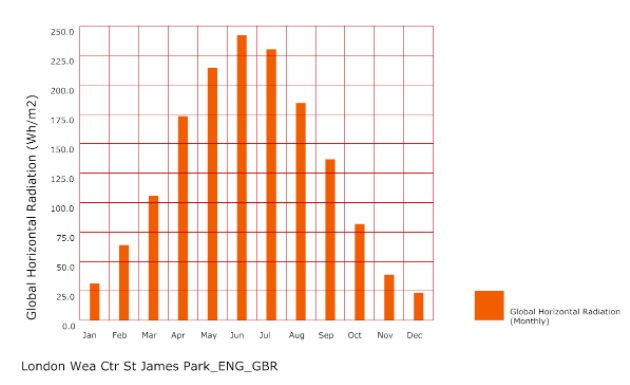
Global Radiation is the highest in the summer months between May and September, especially in the hours around noon.
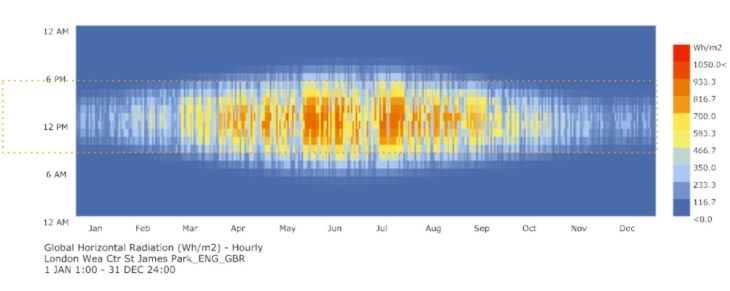

Global Radiation
SKY COVER
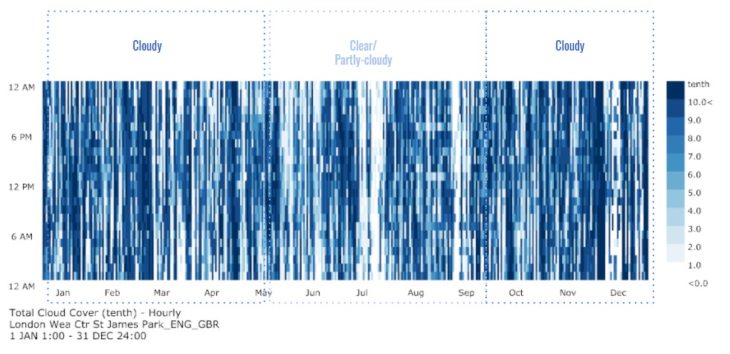
Total cloud cover – Hourly
In London, the average percentage of the sky covered by clouds experiences significant variation in the seasons over the year.
The cloudier months of the year start from the end of September ending in May. The cloudiest month of the year is November.
The clearer part of the year in the city begins around May to September. The clearest month of the year in July.
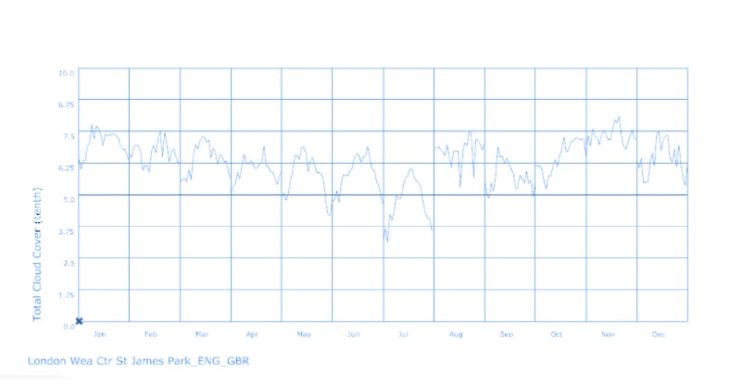
SKY COVER, average day per month
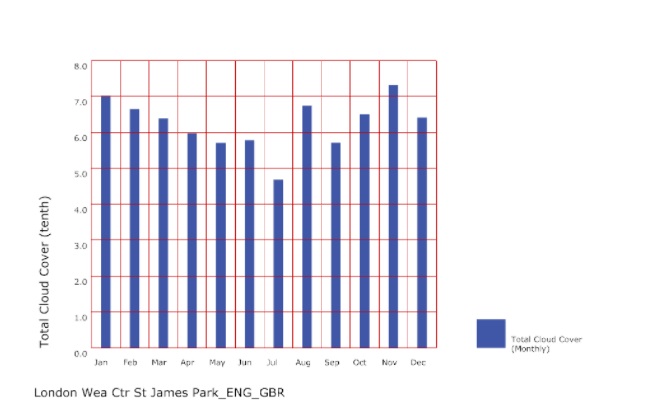
SKY COVER, average monthly
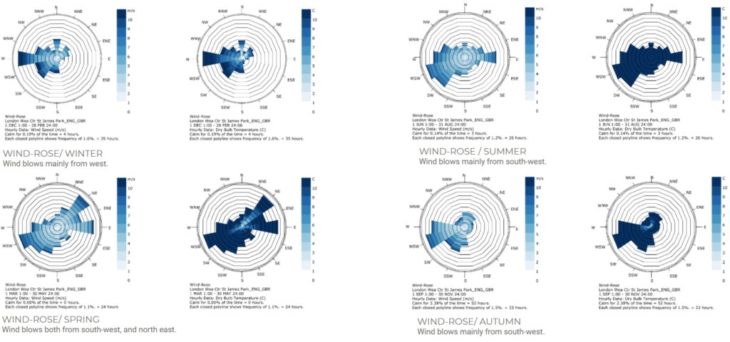
WIND-ROSE CHARTING
//SEASONLY
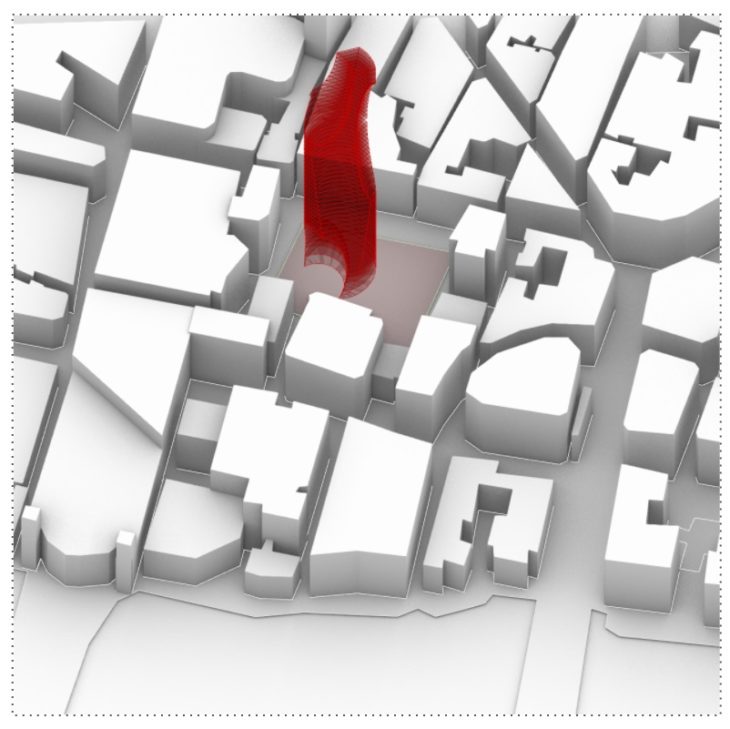
THE PROJECT
Our design is a 49-story tower, for offices.
DAYLIGHT
SUN PATH VISUALIZATION
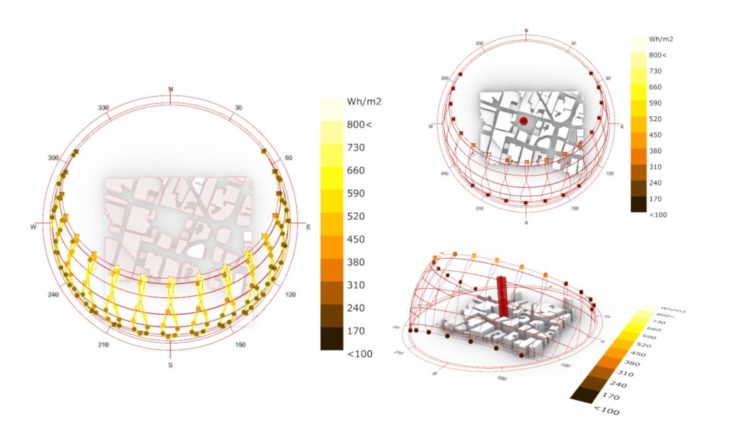
The sun path helps to understand potential heating patterns.
SUN RADIATION STUDY
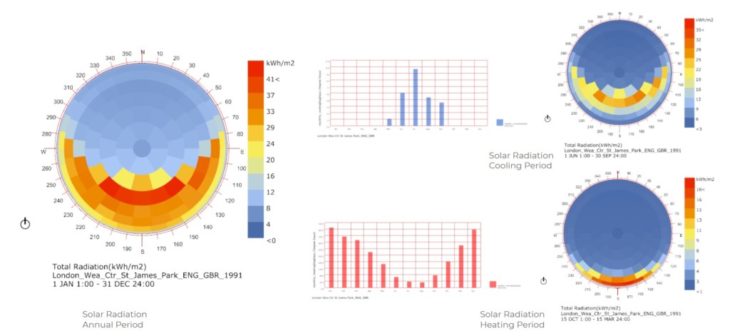
in various periods
SUNLIGHT HOURS
SOLSTICES
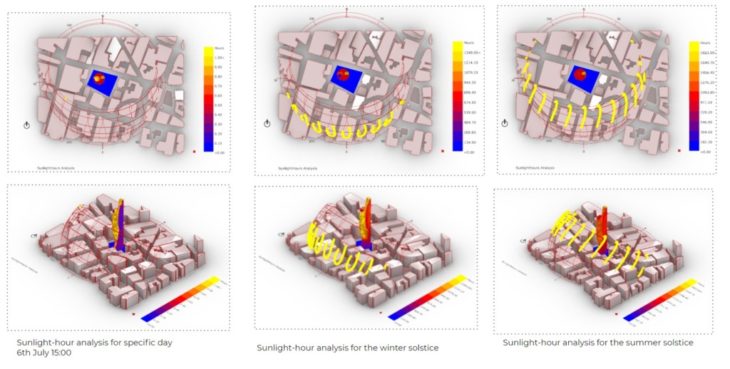
The maximum solar gains happen in the South West, while the North stays shaded most of the year.
SOLAR IRRADIATION
SOLSTICES
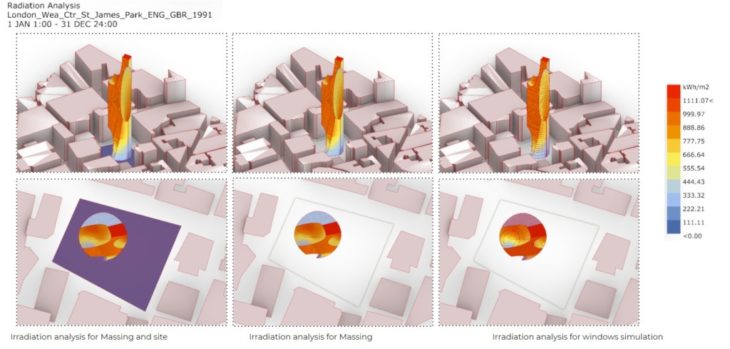
In the building geometry, it shows that the top part of the tower receives higher solar irradiation compared to the bottom floors.
INSOLATION
Insolation analysis for Massing and site
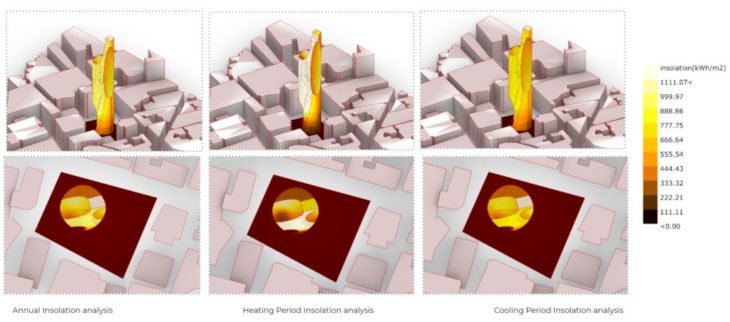
Low angle radiation especially in winter could cause potential glare issues.
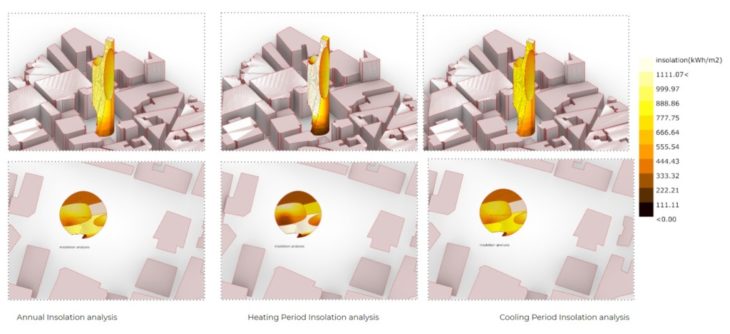
Insolation analysis for Massing
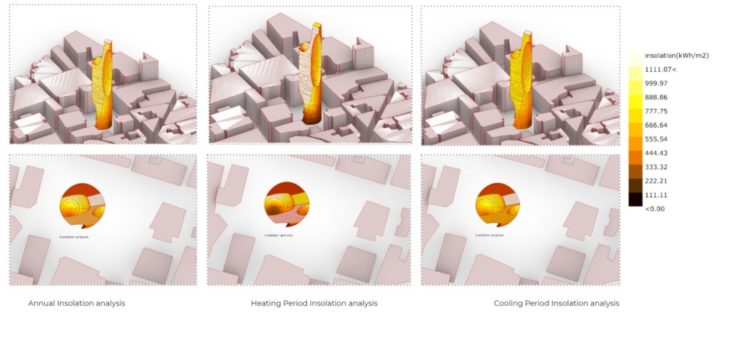
Insolation analysis for windows simulation
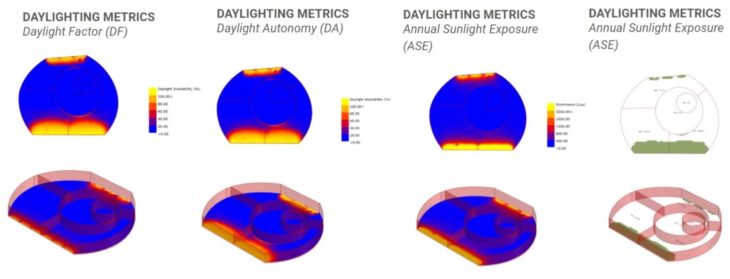
Typical Plan floor
The Daylight Analysis informs us that the floors did not receive the most light inside.
THERMAL COMFORT
THERMAL COMFORT PERCEPTION
In Sun
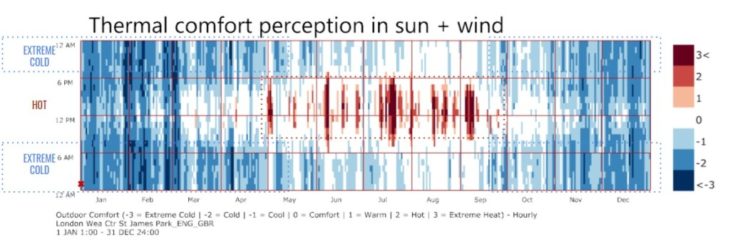
Months between May and September, it is warm in the sun especially from 9am to 6pm, yet the wind factor adds a pleasant feeling through the rest of the day. In the winter it is typically too cold the whole day.

Months between May and September, it is too warm in the sun without wind, especially from 9am to 6pm, but it’s quite pleasant in the early mornings and late at night. In the winter it is typically cold the whole day except a few hours around noon.
THERMAL COMFORT PERCEPTION
In Shade
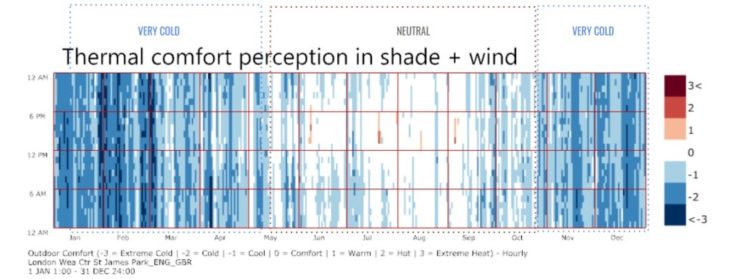
Months between May and September, are cool in the shade, yet the wind factor adds a colder feeling through the rest of the day. In the winter it is typically too cold the whole day and gets extreme between January and March.
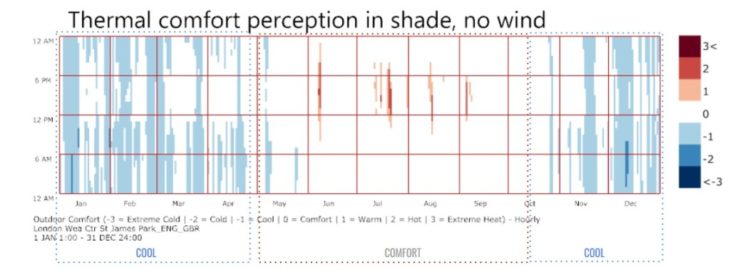
Relatively the months between April and October feel pleasant in the shade with no wind, except a few hours between noon and 6am feels little warm especially in between June and August. In the winter it is typically cool to comfort the whole day.
UTCI PERCEPTION
In Shade
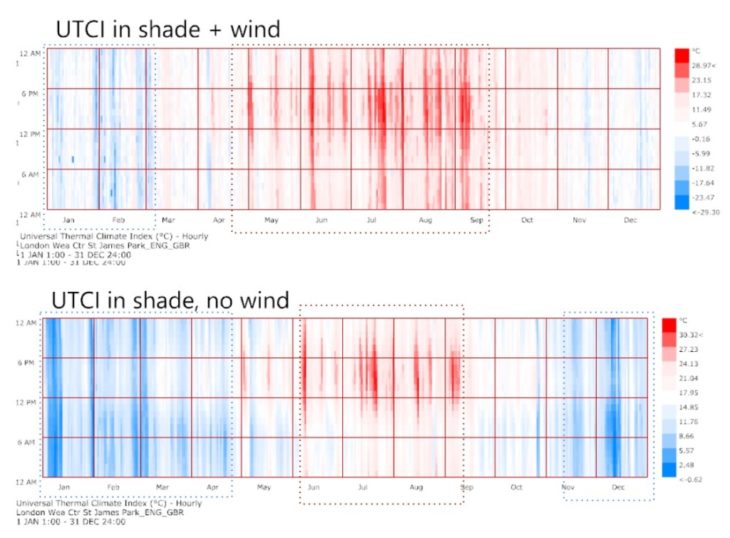
The charts show a significant thermal discomfort almost through the whole day that occurs in the summer months between May till September with heat increase, as well as winter months, creates discomfort with the decrease of heat, especially between November and April.
UTCI PERCEPTION
In Sun

The thermal discomfort intensifies in the summer months mostly around noon between 8am and 6pm, while it reverses in winter months around the same time. The cold thermal discomfort in winter occurs in the early mornings and late evenings.
UTCI PERCEPTION
on the 15tth of Aug.
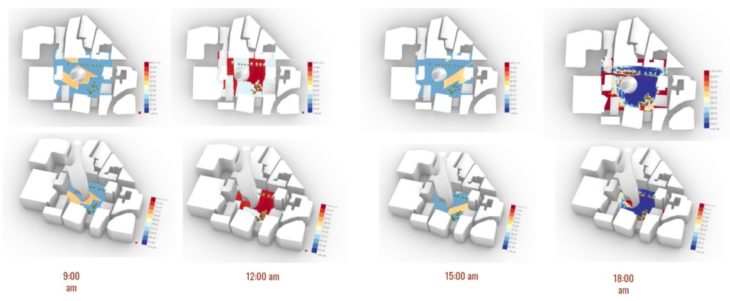
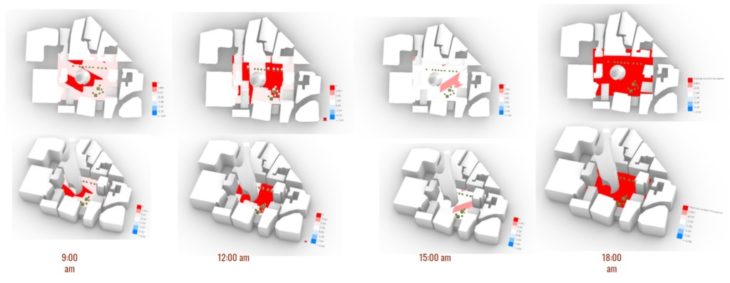
InFraRed
Project Name: Tower

The predominant wind is usually coming from the west.

We tried to rotate the main concave entrance of the tower in three different directions to examine the outdoor wind comfort.
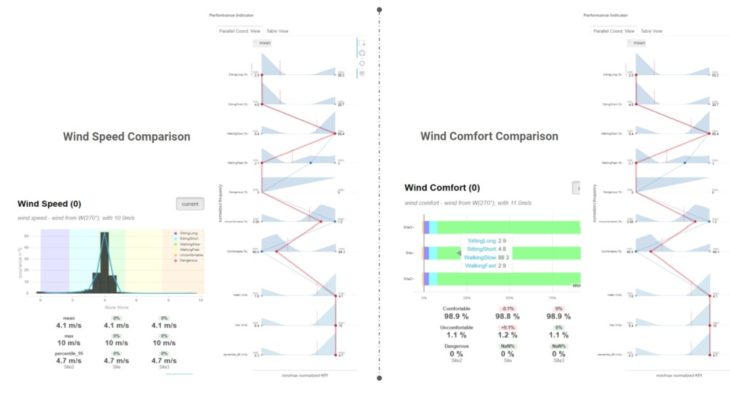
but the result was almost the same cause the tower takes a circular shape.
Next Steps and Conclusions:
- Generate a new massing design to control the glare.
- Use different glass-wall ratios.
- Enhance indoor environmental quality.
- Understand the outdoor thermal comfort zone and integrate more vegetation on-site and on the building.
- Different facade iteration, using dynamic skin.
- Optimize the orientation of the new form using energy simulation.
![]()
LONDON CLIMATE ANALYSIS is a project of IAAC, Institute of Advanced Architecture of Catalonia developed at Master In Advanced Computation For Architecture & Design in 2021 by students: Abed E. Badran, Jumana Hamdani, and Faculty: Angelos Chronis, Aris Vartholomaios, Hager El-Sokaily