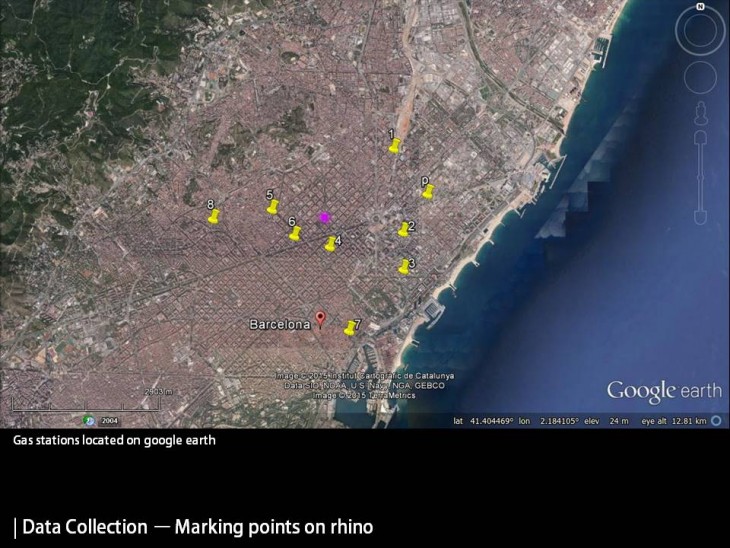
The assignment aims at visualizing data by first laying out a question and relating it to Barcelona, data mining and transferring it on Rhino/ Grasshopper for visualization.
Student : Prajakta Panchal
Tutor : Luis Fraguada
Assistant Tutor : Rodrigo Aguirre

Process
Gas stations are located on the map of Barcelona and the map with the correct co ordinates is imported on Rhinoceros

Process
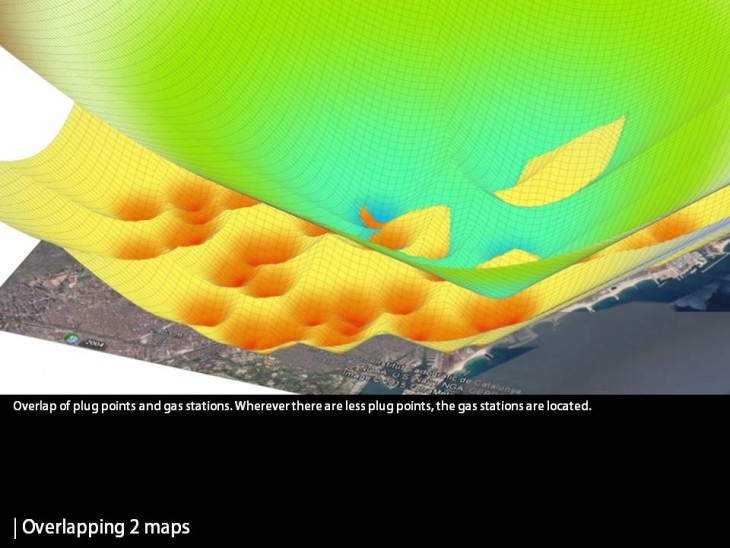
Similarly, electric plug points are also plotted on the map and imported to Rhinoceros

Process
Location is set to Barcelona

Gas stations
This is data visualization of gas stations in Barcelona, located mainly in the centre of Barcelona.

Electric Plug points
This is the data visualization of electric plug points in Barcelona. It can be clearly observed that the electric plug points for cars are more in number than gas stations.

Data Overlay
Data overlay shows that some gas stations and electric plug points are at the same locations.
By definition, data is no more than a set of numbers on which one acts to extract certain characteristics which in turn can be made into information. Data thus is the material by which we create understanding and knowledge. This kind of data can play a vital role in understanding the existing setting of a city in order to derive design logics for a city.