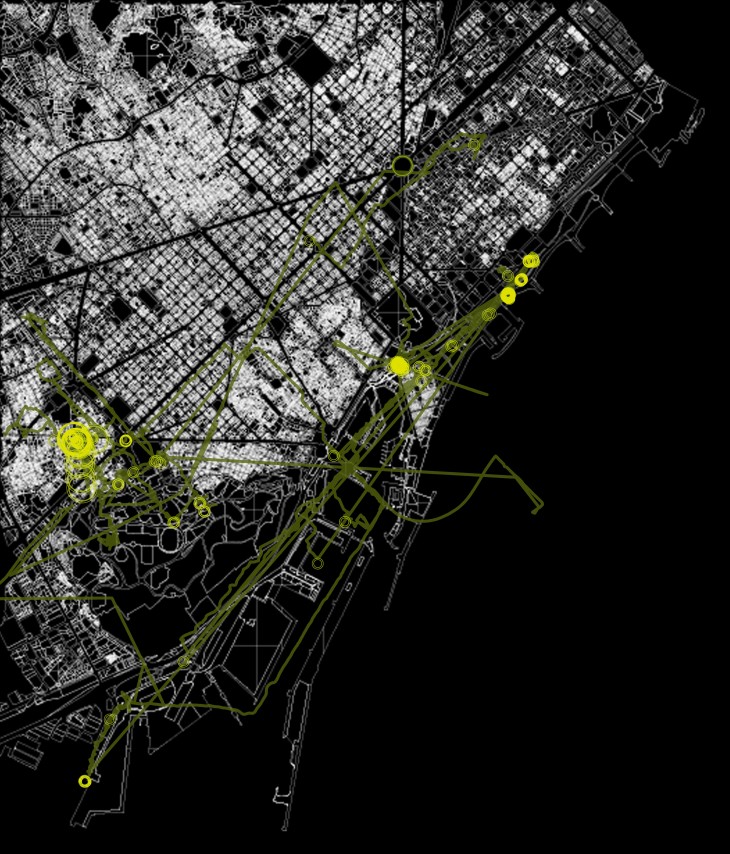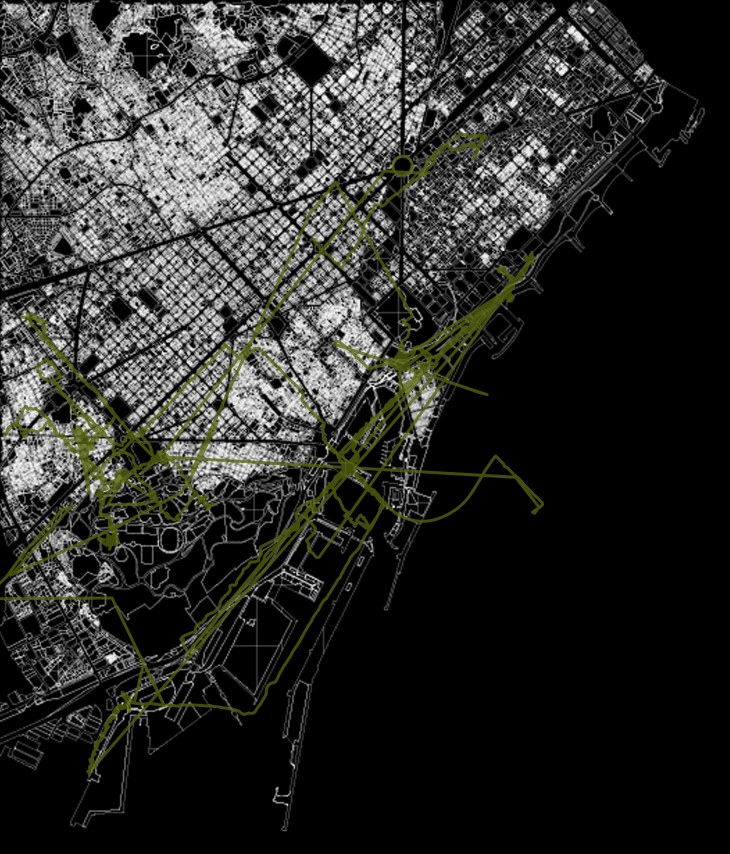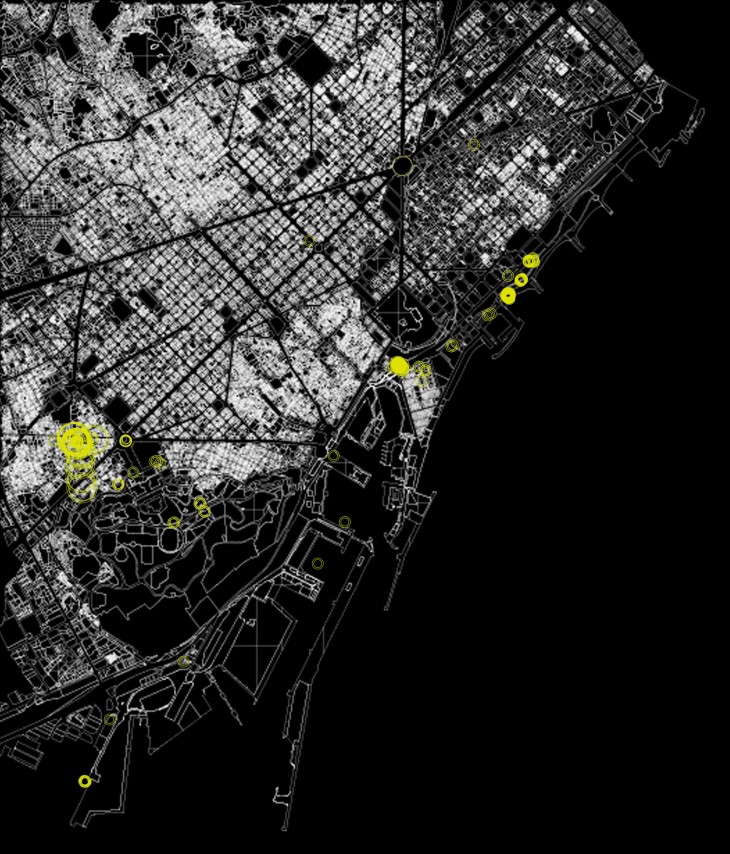
For this assignment I decided to take into consideration data provided from multiple students in class to find possible intersection points with my path and between all of us around Barcelona. What if timetables were organised in that way so everybody was moving at the same time with the same speed and the same means of transport? Then, it would be possible to meet among each other throughout the city at random places. The map would show us which places could be potentially meeting points of Iaac students, in order to pass by (or maybe not!).
In the Grasshopper I loaded the klm files coming from differ-ent students from the class. For each file I made the same procedure in order for the data to be visualised on the map as polylines. In cases that grasshoper couldn’t make the polylines, i made points, lines between the points and then merge all the lines. As a last step, I merged my friends paths together and I intersected them with my path. As a result, we are able to see the points on the map we could have may met (big circles). As a final step, I also merged my friends paths be-tween them, to see where they could have met among them (small circles)


Data Visualisation: People Intersections is a project of IaaC, Institute for Advanced Architecture of Catalonia
developed at MAA01 in 2015-2016 by:
Student: Maria-Klairi Chartsia
Faculty:Luis E. Fraguada, Rodrigo Aguirre