Introduction:
By definition, data is no more than a set of numbers on which one acts to extract certain characteristics which in turn can be made into information. Data thus is the material by which we create understanding and knowledge. While seemingly objective, the way data is obtained, stored, and retrieved must always come under scrutiny, as any of these steps could be manipulated in order to influence certain informative conclusions.
Today we have access to data in many forms and from many sources. Increasingly, we too can become sources of data through many new initiatives, mostly found on the web. “Pachube is a data brokerage platform for the internet of things, managing millions of data-points per day from thousands of individuals, organizations & companies around the world.”
These relatively new formats are built on decades of the classical data entry method, which is the data table. On the web, sources such as government websites and Wikipedia have a plethora of data tables on population, country area, GDP, etc. Even further back, the use of data, and most importantly, the ways by which it was visualized allowed people to understand things such as the way cholera was transmitted. In the 1850’s, Dr. John Snow investigated a significant cholera outbreak in London. He mapped the cholera deaths by the address where the person once lived as well as the pumps from where people retrieved their water for domestic use. The visualization clearly showed a strong correlation between the water source and the proximity of the deaths. With this he made a recommendation to close the pump, which caused a drastic reduction in cholera deaths in the area.
Process:
- Speculation: Thru question, issue, or problem related to a topic currently investigating which is related to Barcelona.
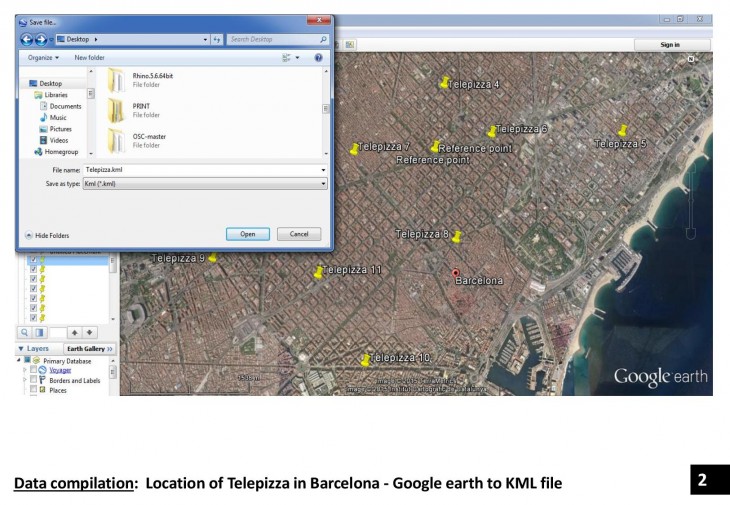
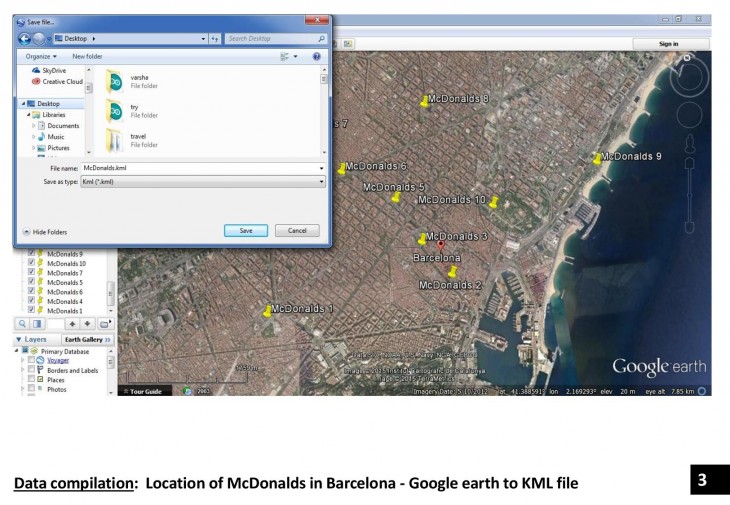
- Data Mining: Finding a source of relevant data.
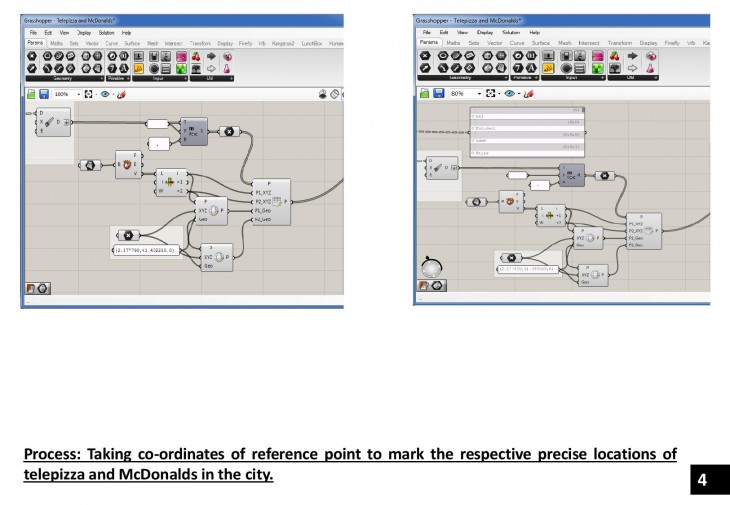
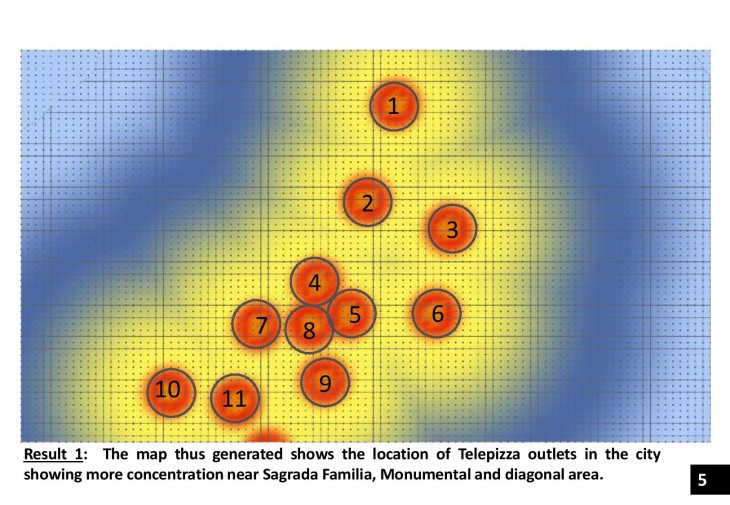
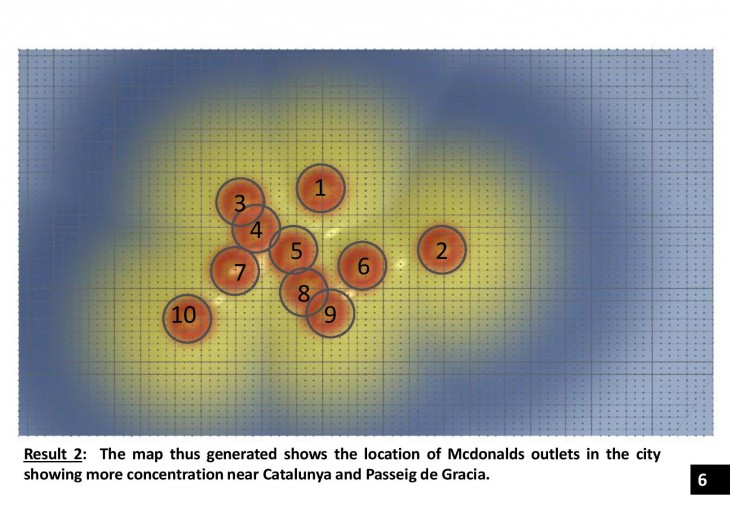
- Data Visualization: Generated using Rhino and Grasshopper.

Data visualization is a project of IaaC, Institute for Advanced Architecture of Catalonia developed at Master of Advanced Architecture in 2015/16 by:
Student:
- Dhairya Thakkar
Faculty:
- Luis Fraguda
- Rodrigo Aguirre