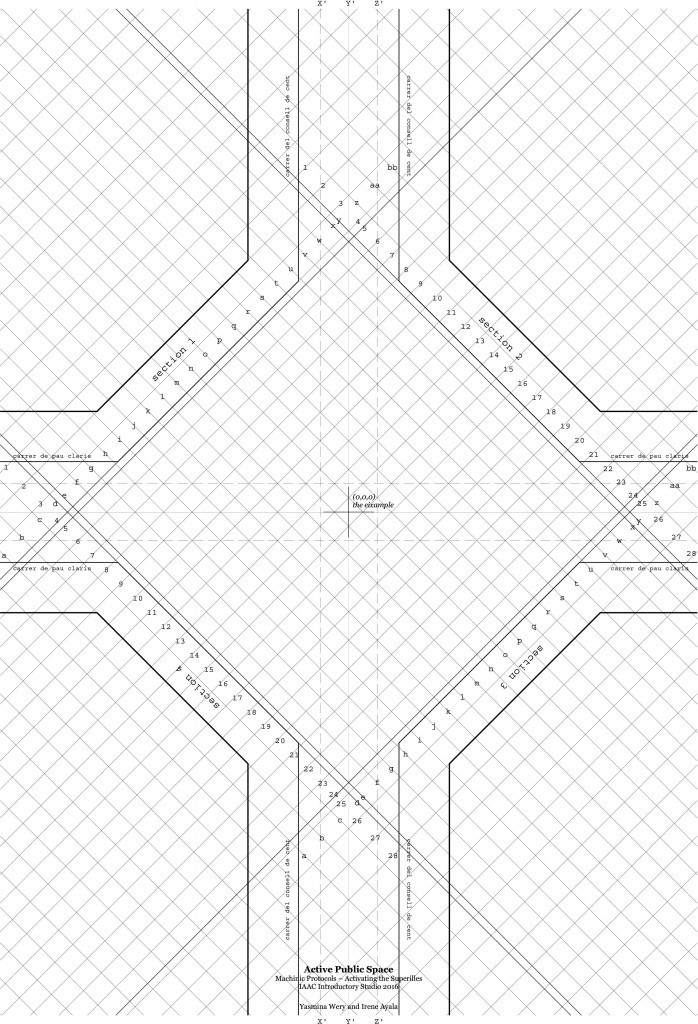
Strategy 1
Topic: The frequency of recycle disposal
Our intention is to map this during high pedestrian traffic times, three times a day. We will record the data on the morning, afternoon and evening on alternating days of the week in order to get a comprehensive set of results. Each instance that we map will have a duration of two hours. The information is able to be recorded as numbers because we will observe a recycle bin at a popular corner and tally the number of people that dispose their recycled material. In addition, we will monitor different types of recycled trash such as plastic, glass, paper etc. Lastly, we will monitor the direction people are walking from when they come to dispose their trash and where they are going. This will allow us to understand geographically the areas where people tend to recycle more than others. We will reflect this data on the drawing through frequency of lines and line thickness.
Strategy 2
Topic: Movement of leaves based on climate
For this strategy, we will map the movement of leaves based on different climates such as rainy days, windy days, sunny days etc. We will repeat these instances on varied times a day, based on weather, for a duration of two hours at a time. This strategy can likewise be recorded as numbers because we will count the number of leaves that move from point A to point B along with the varied types of leaves present. For example, on a windy day we will monitor how the wind is moving the leaves or on a rainy day how the water changes the place of the leaves. This will allow us to take into consideration the locations where the most diverse leaves accumulate and hence give us insight on geographic settings that are more nature filled. This data can be translated onto the drawing through points and lines portraying the movement. Line thickness can also be used to distinguish varied types of leaves.

Students: Yasmina Wery and Irene Ayala Castro