STEP 1: Tracking Movement
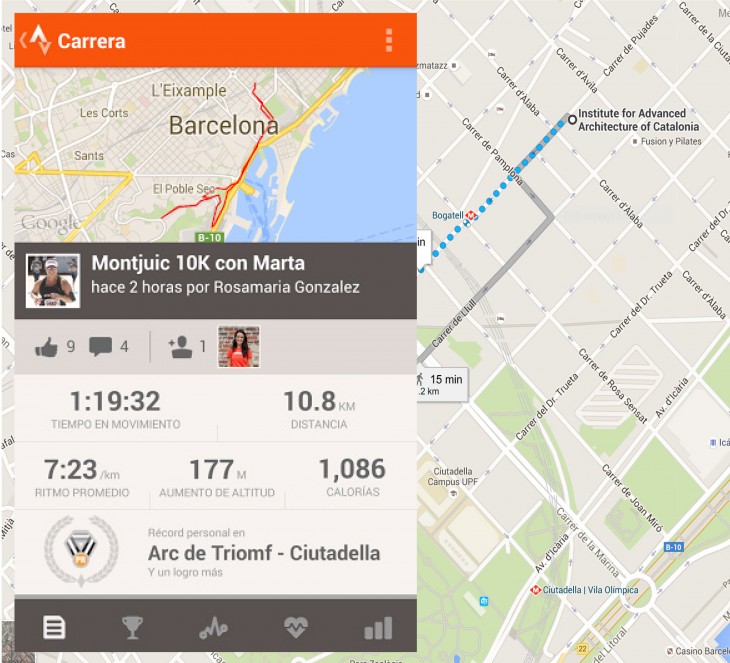
To start with, I downloaded an app called “Strava” for iPhone. With this app I started tracking my movements for a week.
For the assignment I decided to gather information from other students in IAAC to make the visualization more interesting.
STEP 2: XY Coordinates
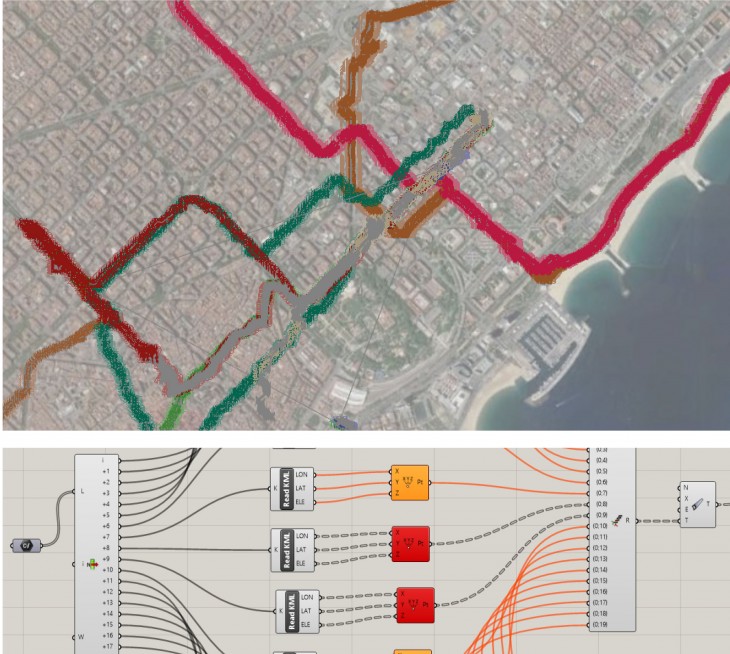
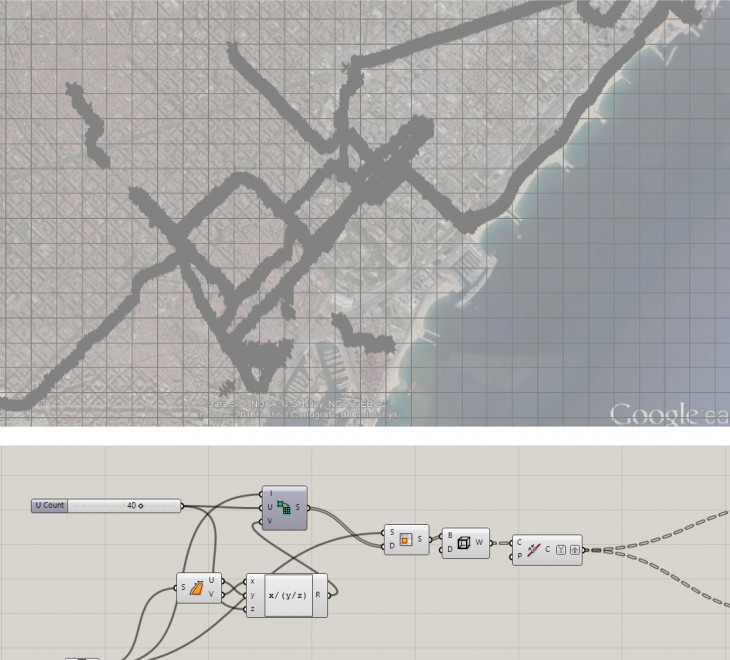
For this step, I used Grashopper to apply the information from the files on a map. Here, I could already appreciate the conglomeration of points on determined sectors, so I decided I wanted to show the areas more visited by IAAC’s Students.
STEP 3: Coordinates System Grid
I created a coordinate grid to sectorize areas in barcelona. This gave me the posibility to analize each sector in particular, having as a result, a number of points per sector.
STEP 4: Extrusion
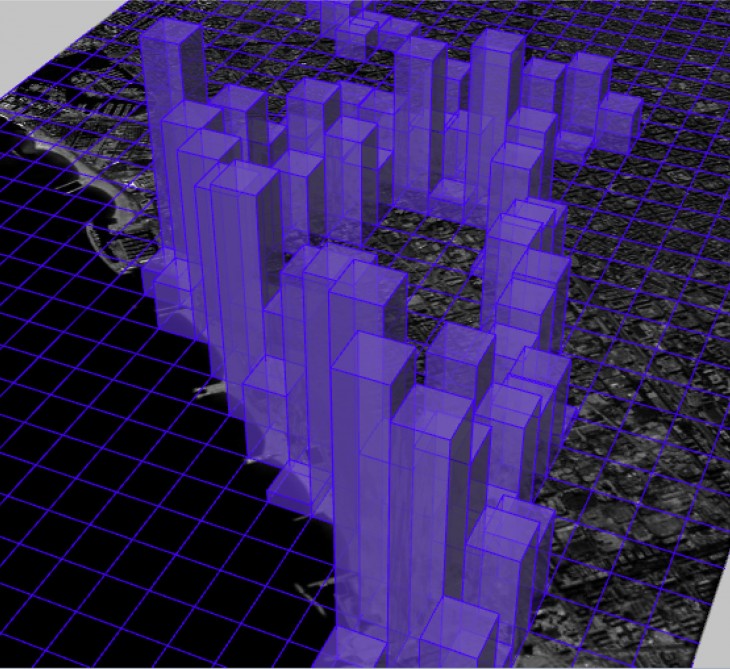
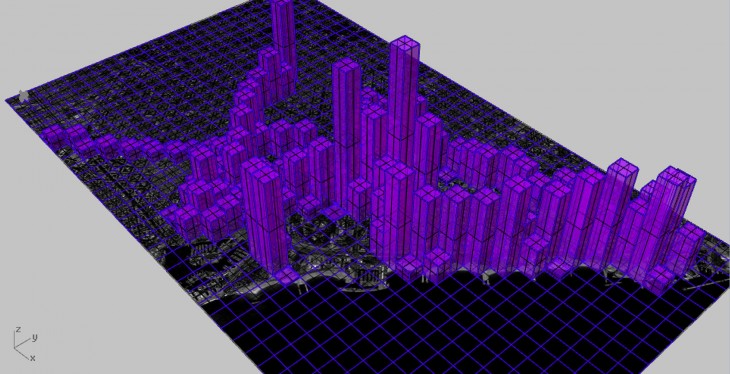
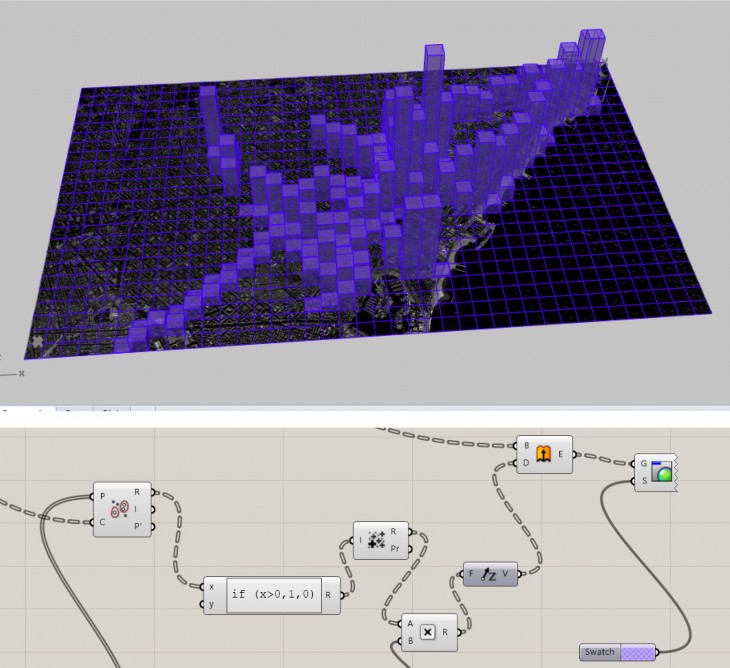
For the last step, I represented the amount of points in each sector with different heights. The more frecuently visited an area, the higher the extrusion.
CONCLUSION
As a conclusion, I would say IAAC students frequent Poble Nou, Eixample, Gotic and Gracia neighbourhoods the most.
