The Data collected and mapped is unfortunately not connected to any of my projects at the time, having in mind that all are far away from real architecture and functions for now. So being a European from a country (Bulgaria) that just has recently joined the Union, I decided to pick a topic related with the other candidates applying for membership. 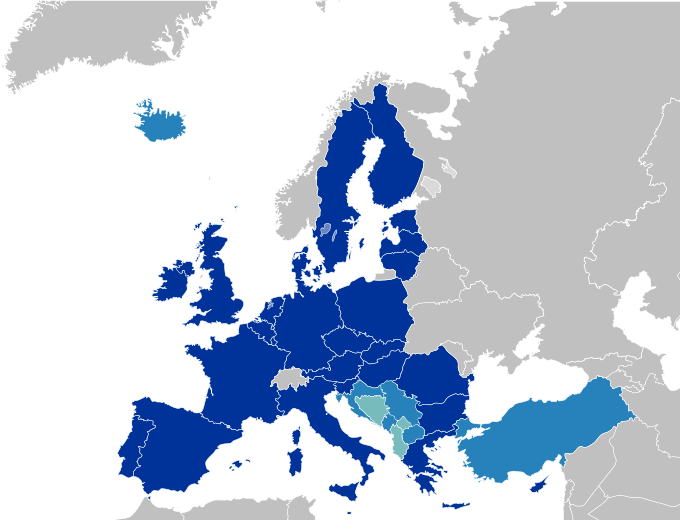 Reference links:
http://commons.wikimedia.org/wiki/File:EU27-candidate_countries_map.svg
So I found myself an excel table, cleaned it up deleting the unnecessary information so Grasshopper can read the file easily, than saved it into a “comma separated file”. 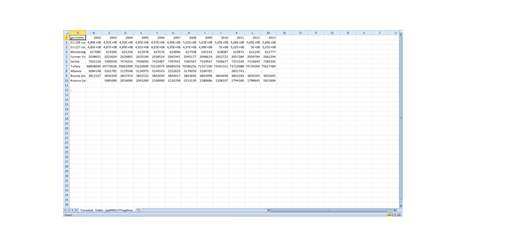 Reference links:
http://epp.eurostat.ec.europa.eu/tgm/download.do?tab=table&plugin=1&language=en&pcode=tgs00027
http://epp.eurostat.ec.europa.eu/portal/page/portal/population/data/main_tables
http://epp.eurostat.ec.europa.eu/tgm/table.do?tab=table&init=1&language=en&pcode=tgs00027&plugin=1
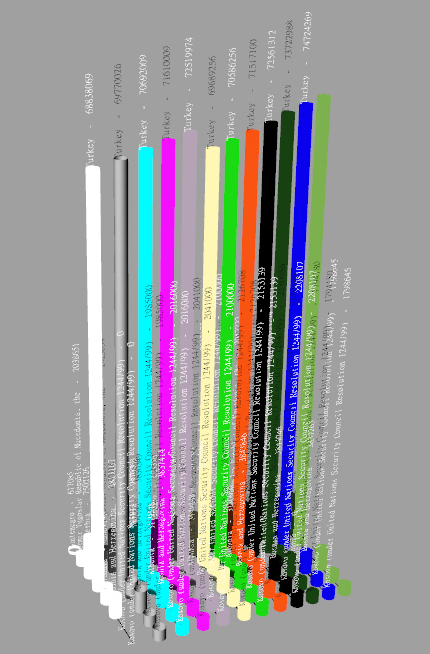

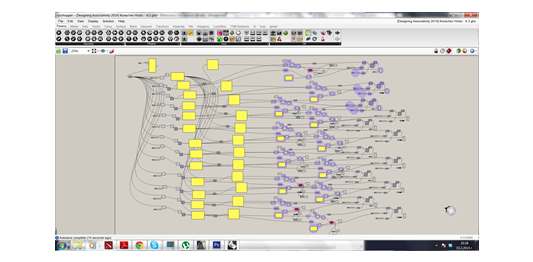 My skills proved not to be enough for getting a % ratio of the population growth, or compress the definition to something better than a huge copy + paste monster. However the mapping result is still kind of awesome. 🙂
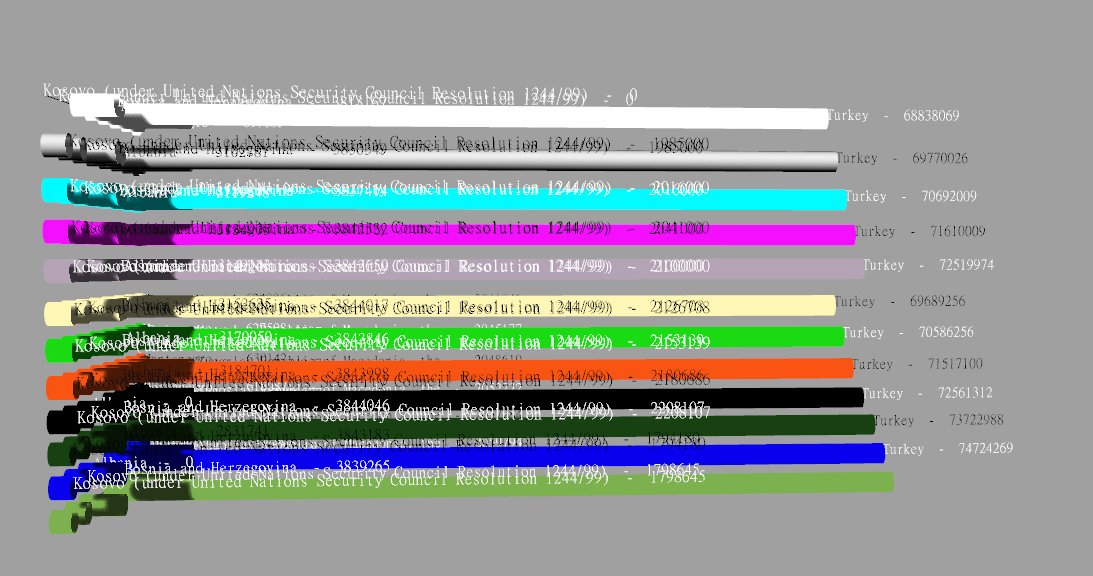