Abstract
A good connection is one fundamental requirement for the creation of a new ecological corridor.
Moreover, if you are planning a rewilding project, you need to know which are the best places to do your interventions, and where they are. The scope of identi-crop is exactly the one to allow you to discover the characteristics of the place you are working on.
Introduction
The first stage of the project was based on the analysis of the site: El Vallès plain. This place is so densely inhabited that cities, industries and cultivations mingle in a unique landscape. Moreover, another principal characteristic of this territory is the large number of abandoned crops. And these lands represent a great opportunity for the development of a rewilding project.
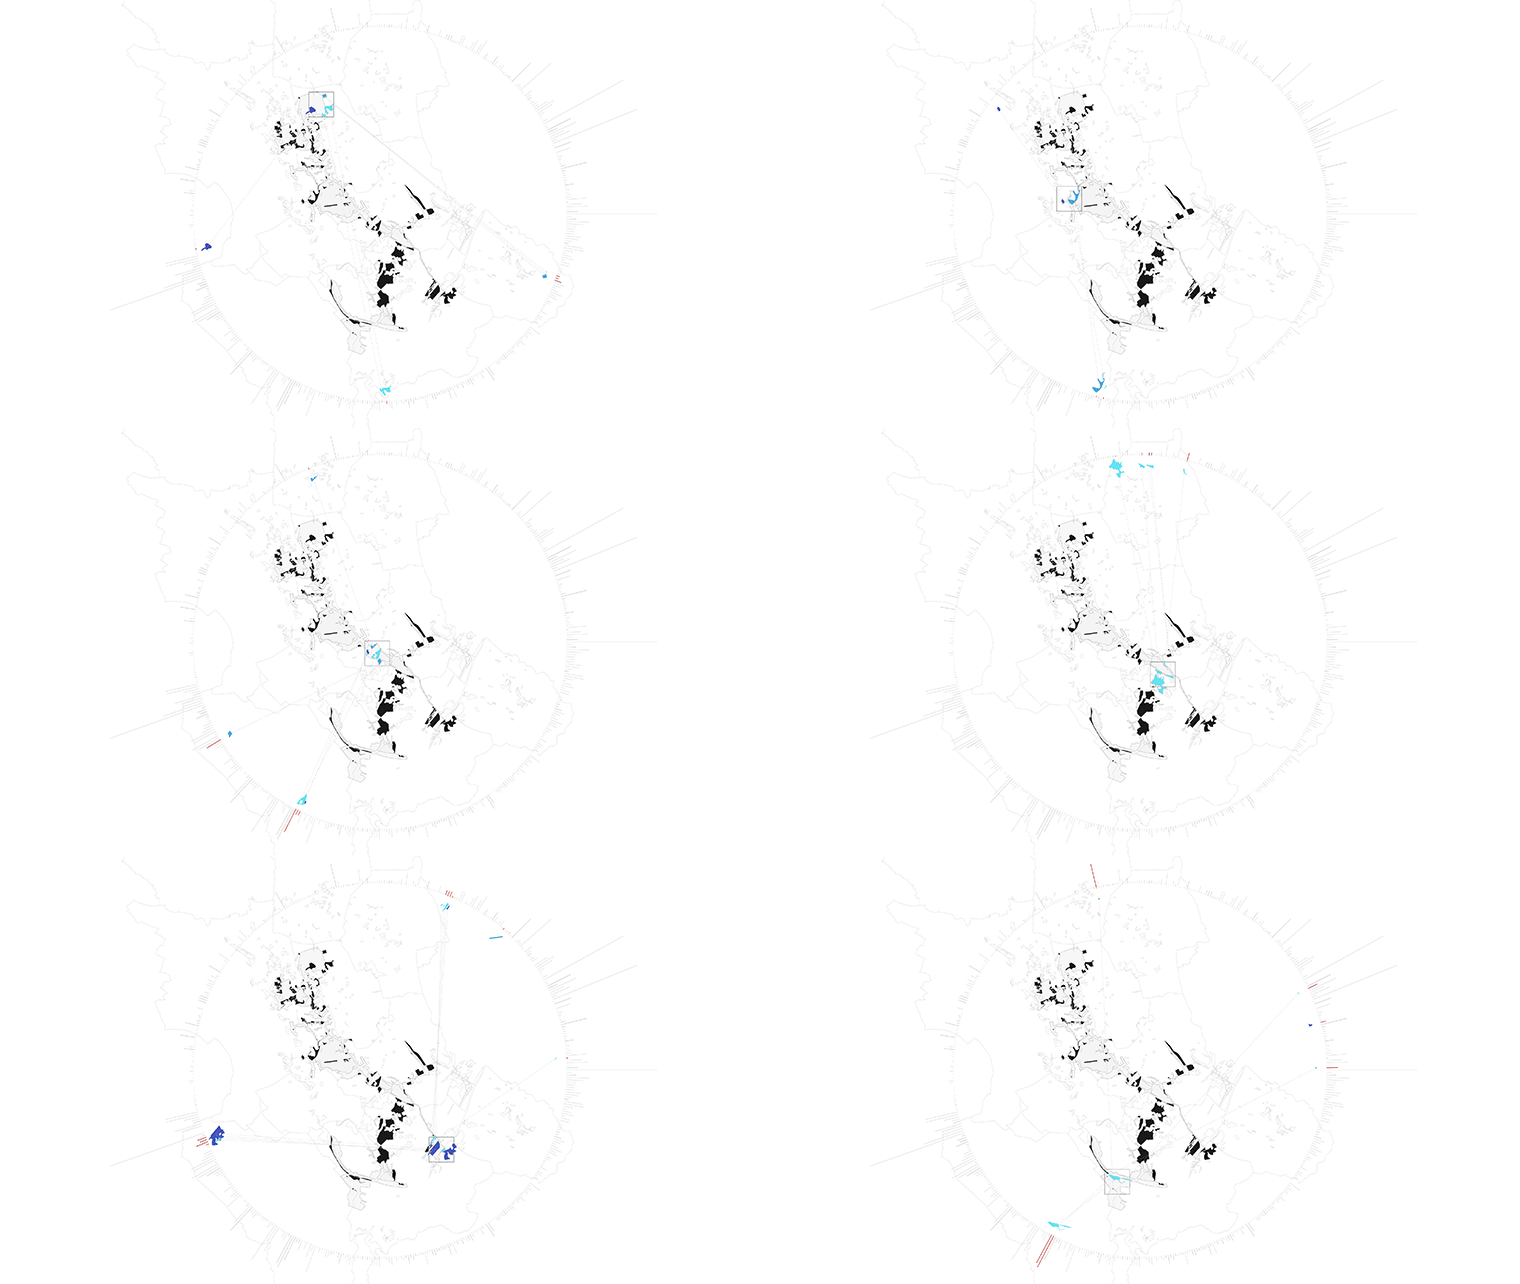
The peculiarities of this place brought us to pay particular attention to the surroundings of each crop and to allocate the abandoned crops in five categories, according to their position and the relationships with their surroundings. The selection of the crops is based on the ones that are inside a unique natural or anthropogenic ecosystem, and on the ones that are in a way part of an ecotone among the different ecosystems.
The second step of the analysis consists of the formulation of a connectivity index. It derives from a simulation of the flows moving on the land, according to its use, carried out on the whole plain. For example, this index allows to understand how much the crop improves the transition of animals, a key aspect for the right continuation of the design process.

The functioning
The collection of data and the creation of a proper dataset was the previous step for the development of this project.
The functioning of the tool is based on two criteria, that could define two strategies for the project.
The first is about the verification of an intuition. Once you select the crops inside the map, you can immediately know the context and the capability to be permeable of those specific crops. A range of colours tells you the category of the ecosystem the crops belong to, while a histogram highlights the connectivity index of the selected crops, and you can compare the results with the indexes of the other ones.
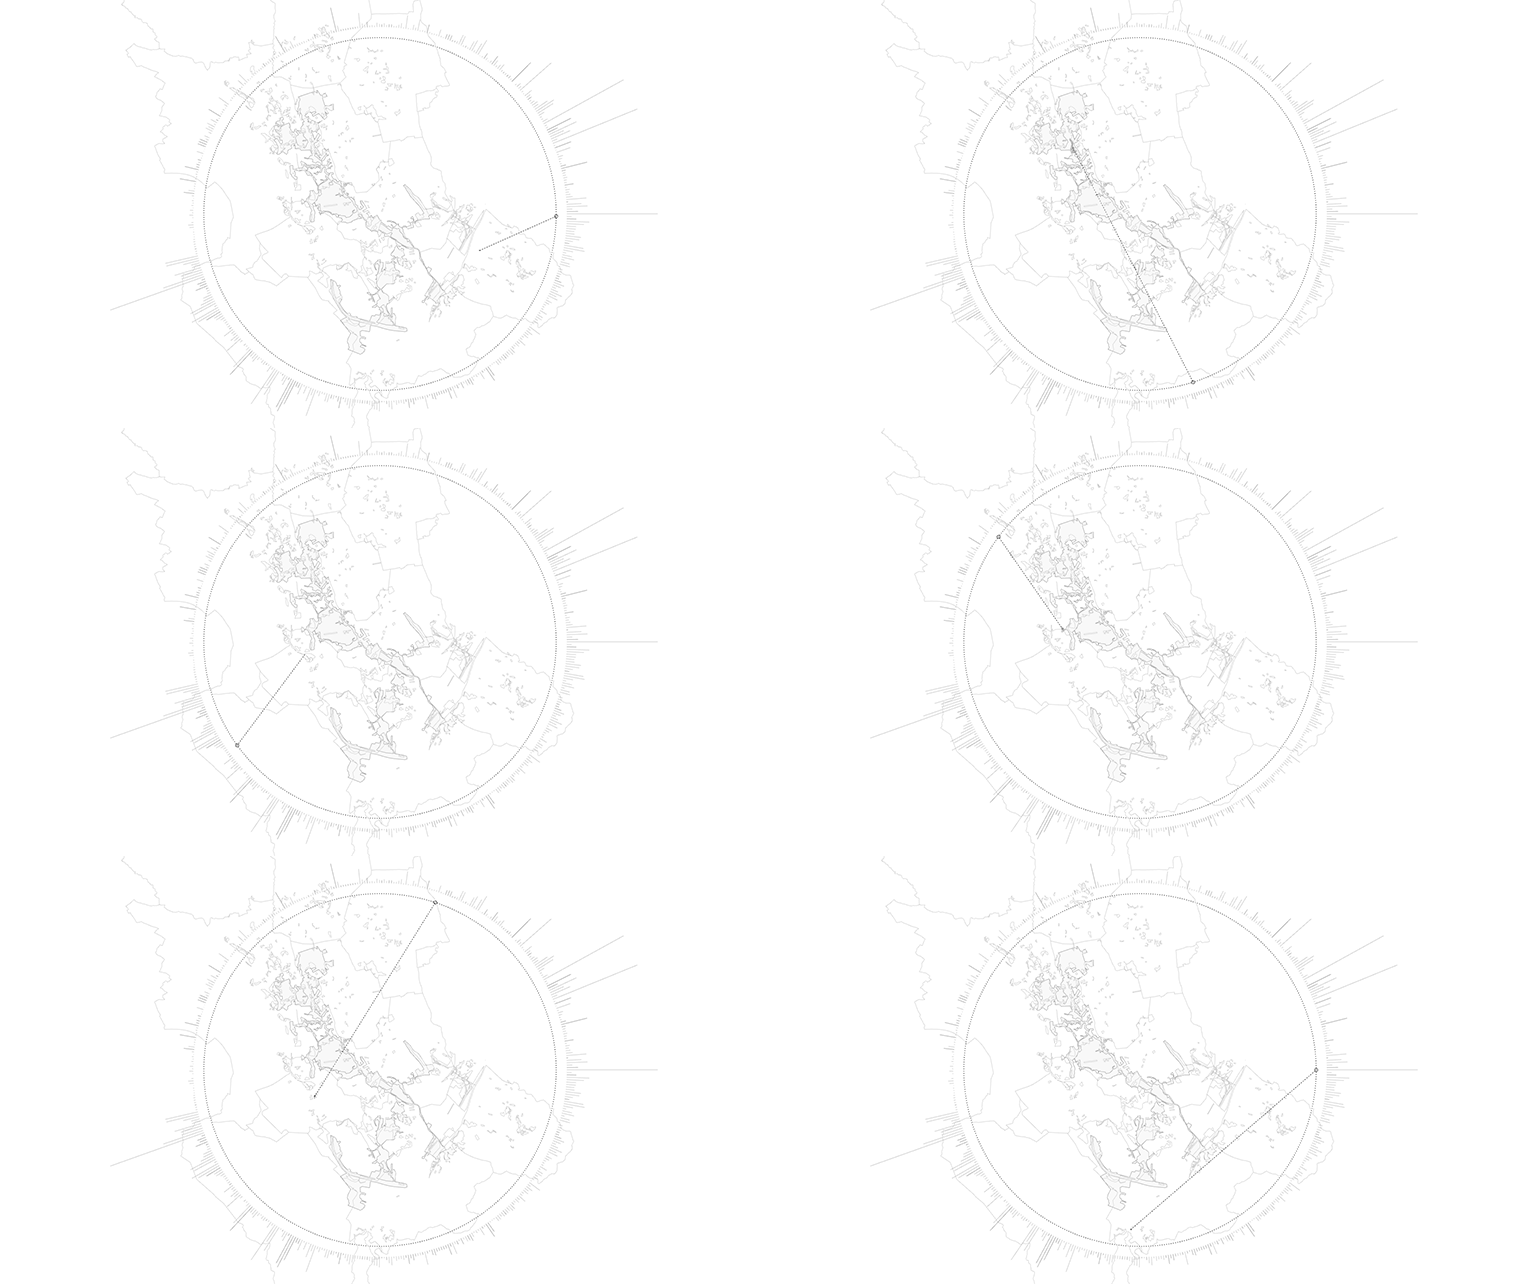
The second way to use this instrument is starting from the connectivity index. So, if you want to know which are the crops with the higher performance, you only need to select the related dots and the algorithm will show you the exact location of that crop.
In the end the tool can be used also merely to visualize the information in possession. A clear representation and a way to explain the choices behind the project.

identi-crop is a project of IAAC, Institute for Advanced Architecture of Catalonia developed in the Master in City & Technology in 2020/21 by student: Matteo Murat and faculty: Eugenio Bettucchi & Iacopo Neri.
