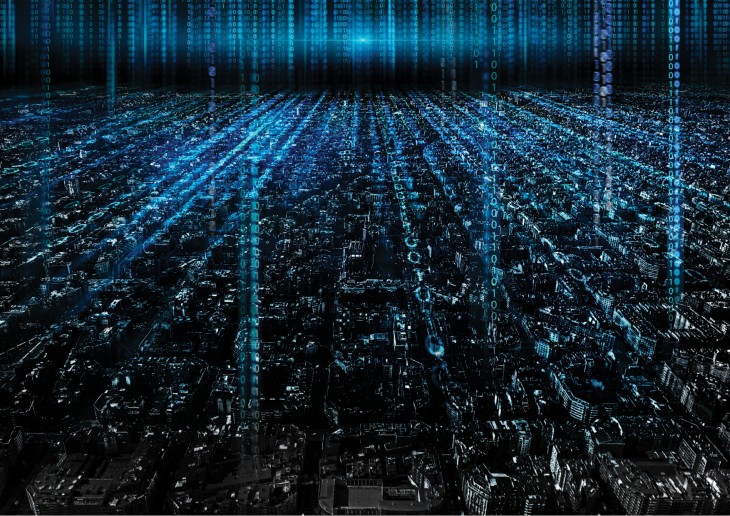
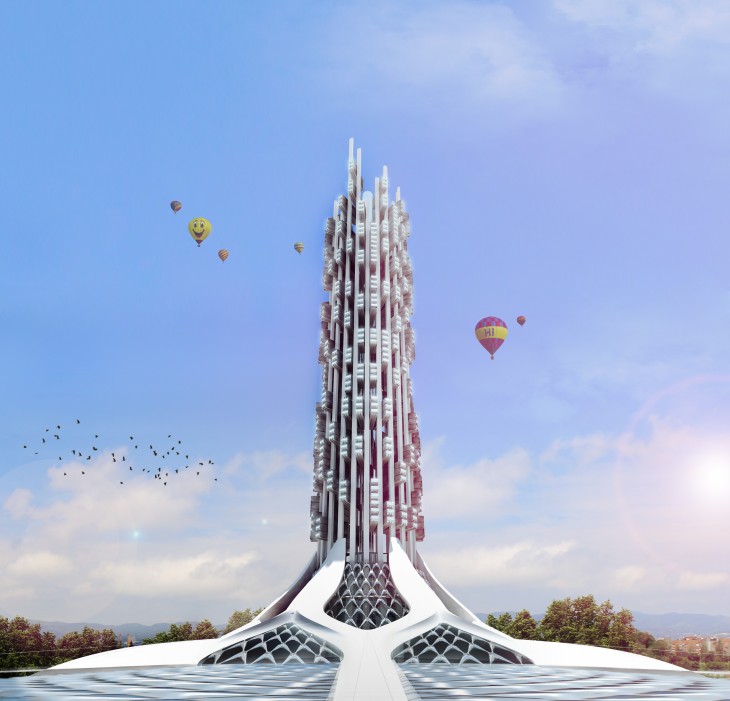
Infostructure is a hybrid structure combining energy generation with data storage and data processing in Barcelona.
As cities get smarter, they have generated more data in the last two years than in the entire history of mankind.
The ancient Mayans are often recognized for their ability to accurately analyze the sky through constant observation with the most primitive tools. Antique tablets provide confirmation of their deep understanding of astronomy. As they were able to utilize their billions of years worth of data through the stars and planets as their resource to influence their way of life, data has turned into our asset and is molding new possibilities for our future.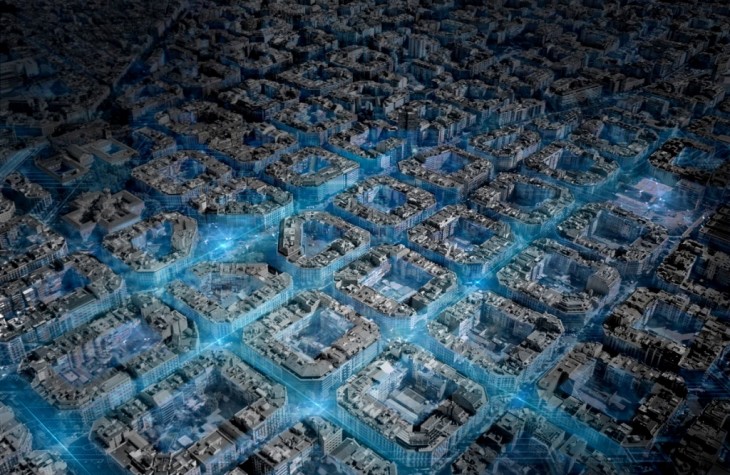
Globally, data traffic over the Internet will reach 511 TBps in 2019, the equivalent of 142 million people streaming HD videos simultaneously, all day, every year.[Cisco Visual Networking Index].
Over the past decades, the Internet has developed to the most complex and largest infrastructure created by humankind.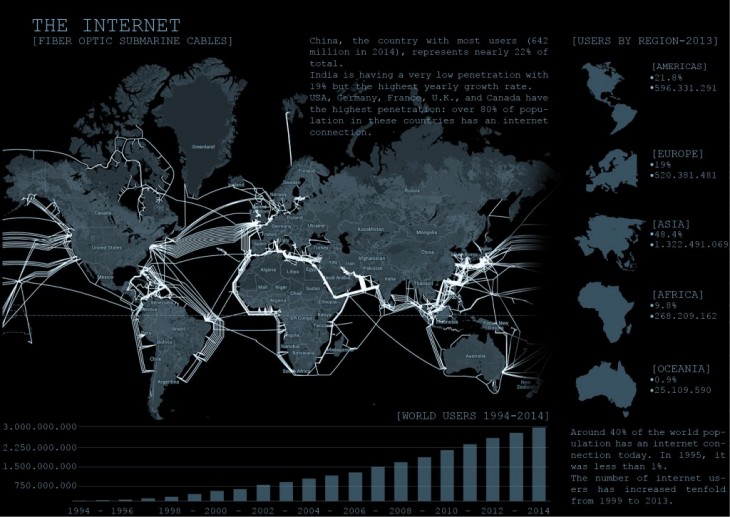
With the rise of the Web from a network for scientists to a global digital infrastructure data seems to be everywhere and constantly gaining in importance.
Even in the field of architecture or urbanism data became the main asset in planning smart cities of tomorrow. Without knowing the exact vision for a smart city, whether it will be a self-sufficient, sustainable eco-city, a totally “wired” city, controlled by a large “mission control” center or a showcase for urban planning concepts, it is safe to say that the intelligence needed to be injected as a fundamental building block in each city will be definitely data. The amount of data on the planet is set to grow from around 4.4 zettabytes (2014) to 44 ZB (2020). 10% of it will be generated by the Internet of things.
[Cisco – Visual Networking Index]
But how do we manage this tremendous amount of information? Regarding the smart city as a future-oriented urbanism; driven by data it is realistic that every single element from building materials to the streets, pavements, and public spaces will provide information that will help the city authorities in planning and managing the city.
Cities are becoming more and more unpredictable and dynamic and they require more flexible approaches to their planning and management.
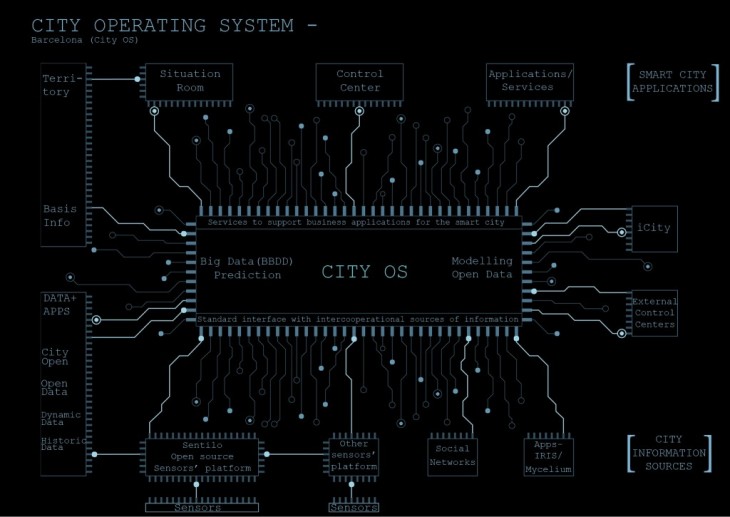
To manage all communication flows in the smart city, the City Council of Barcelona needed an instrument (CityOS) to operate this information avalanche through the integration of physical and intelligence layers to inform policy making and improve services for citizens.
CityOS is a decoupling layer between data sources and smart cities solutions. It consists of four main elements: ontology to organize data, a main data repository, A semantics to unify and globalize access to data, and a data process container.
CityOS integrates the most technical sys- tems, which Barcelona has developed over the last few years – like the Sentilo platform, which manages the city’s installed sensors.
[Ha?bitat Urba?, Institut Municipal d’Informa?ti- ca: “Inside the City OS”]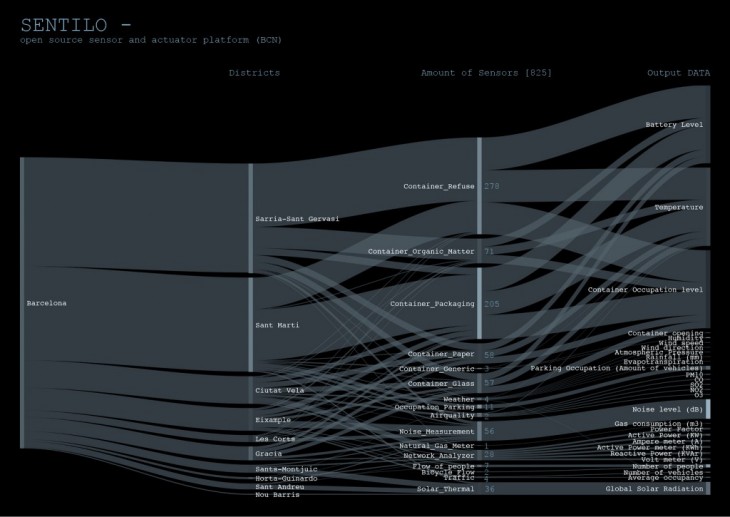
-this case study was developed to see what kind of sensor we find most in Barcelona.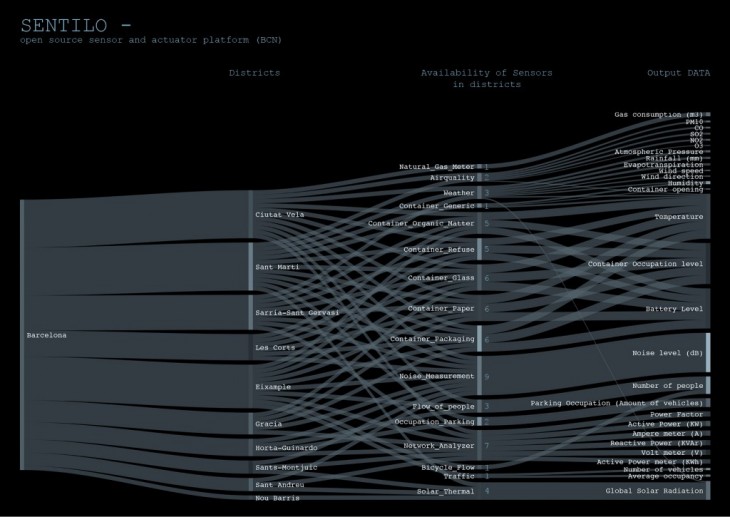
-this case study was developed to see in which district of Barcelona we find most of the sensors.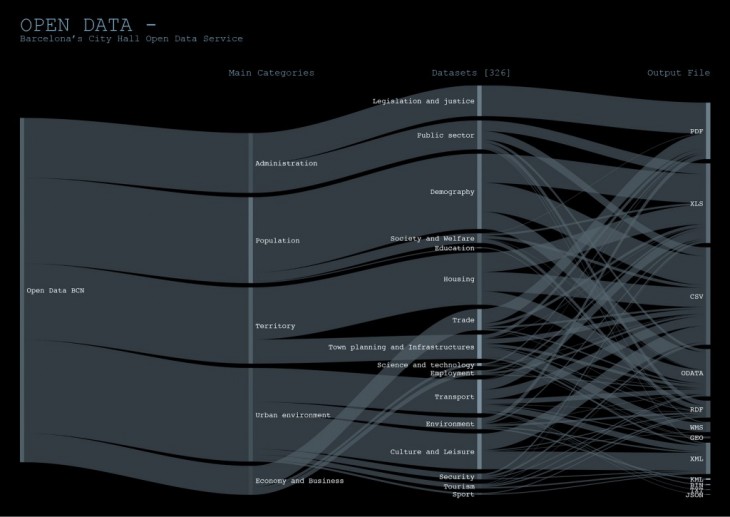
– this case study was developed to see which datasets are free accessible and what file output do we get from them
The CityOS operates on the cloud computing system, meaning that the data processing and storage is happening in the cloud.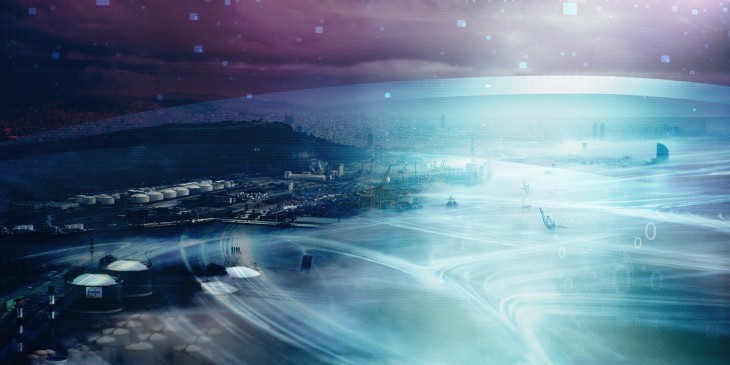
Cloud computing as a technology is an essential resource for mankind. It is an internet-based computing, where shared resources and information are provided to computers and other devices on-demand.
Cloud computing and storage solutions supply users and companies with a wide variety of options to store and process their data in third-party data centers.”The Cloud” is a virtual storage space created by numerous colocation data centers around the world.
Cloud computing uses a hub-and-spoke architecture. This hub-and-spoke allocation model is a system of connections arranged like a wheel in which all information flows move along spokes towards the hub at the center.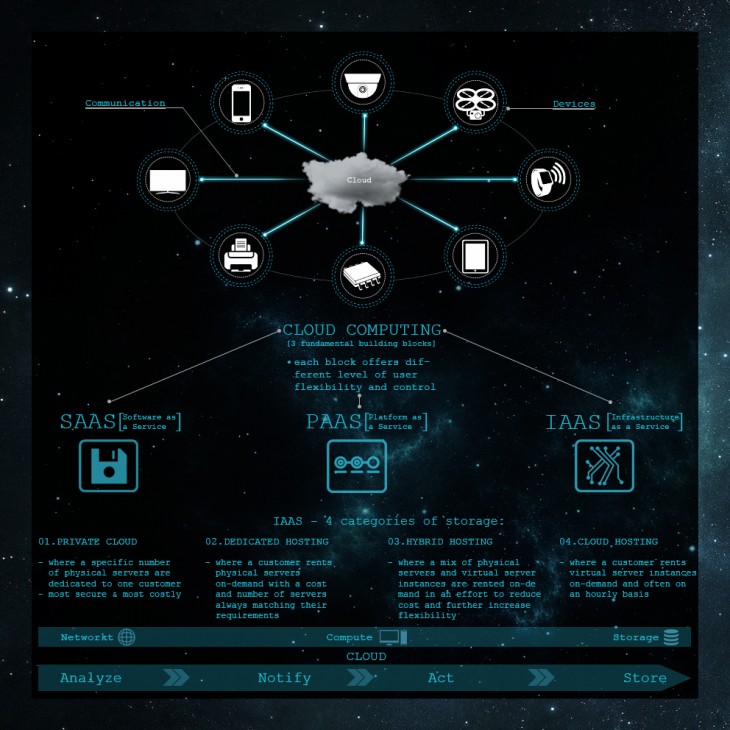
Though this design model works well today, it is most likely to collapse in case of adding billions of devices and microdata transactions that are
incredibly latency sensitive.
This is where the idea of “fog computing” begins. It is a term named by CISCO, but most IT companies are developing architectures that describe how the Internet of things will work by creating the fog – moving the cloud closer to the end user.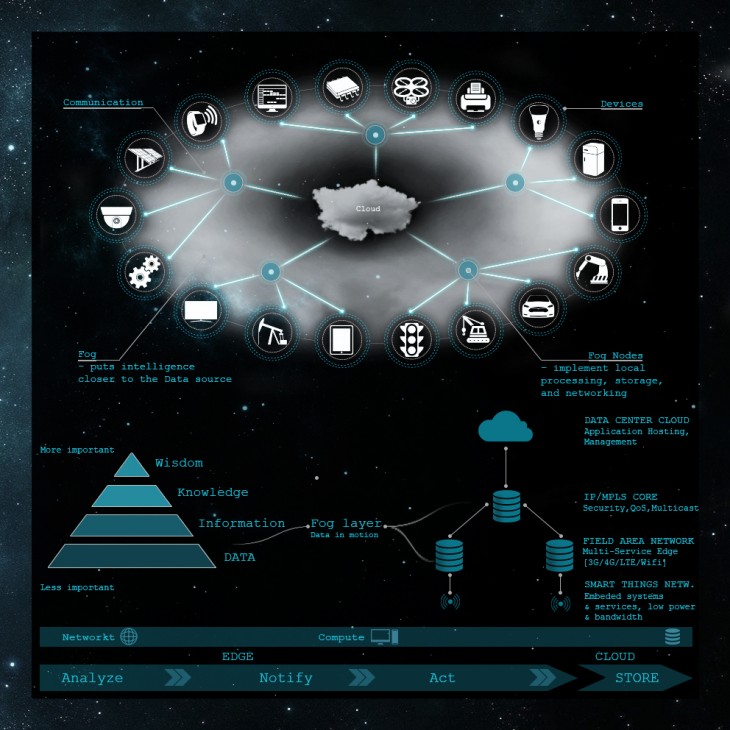
Every day we produce 2,5 quintillion bytes of data (Thales Group). “Thales” estimates that by 2020, 50 Billion Internet of things connected devices will exist in the world regarding the world’s population of 7.6 Billion people.
According to Cisco:
– By 2019, the Gigabyte equivalent of all movies ever made will cross the global internet every two minutes.
– Annual IP traffic will pass the Zettabyte (1000 Exabytes) threshold by the end of 2016, and will reach 2 Zettabytes per year by 2019
– Mobile data traffic has grown 4000-fold over the past 10 years and almost 400-Mil- lion-fold over the past 15 years.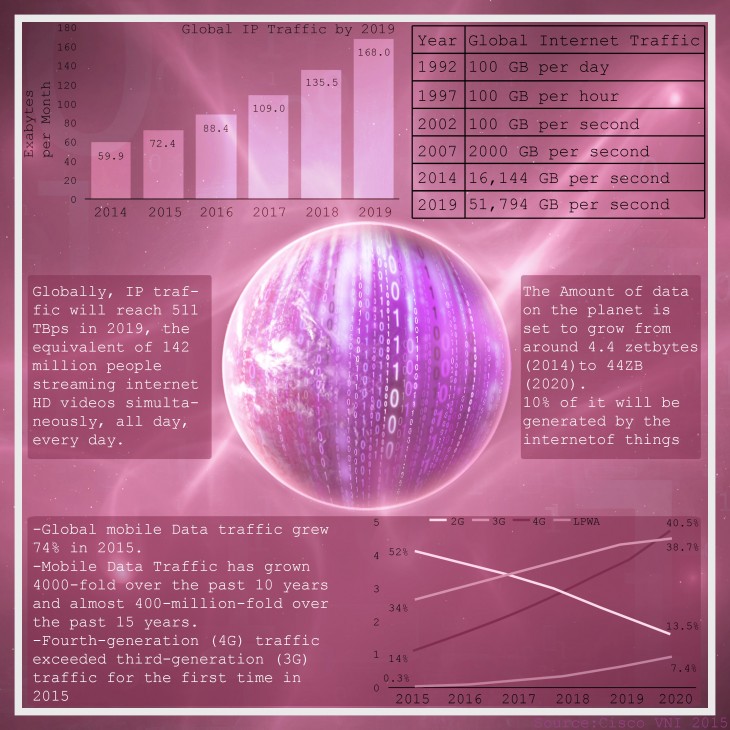
Short examples of statistics that show the data explosion we are living in:
In 2012, Google received over 20 Million search queries per minute.
Today, Google receives over 40 Million search queries per minute from the 2.4 Billion strong global Internet populations. Google processes 20 Petabytes of information a day – while all the written works of mankind created since the beginning of recorded history in all languages equals 50 Petabytes of information.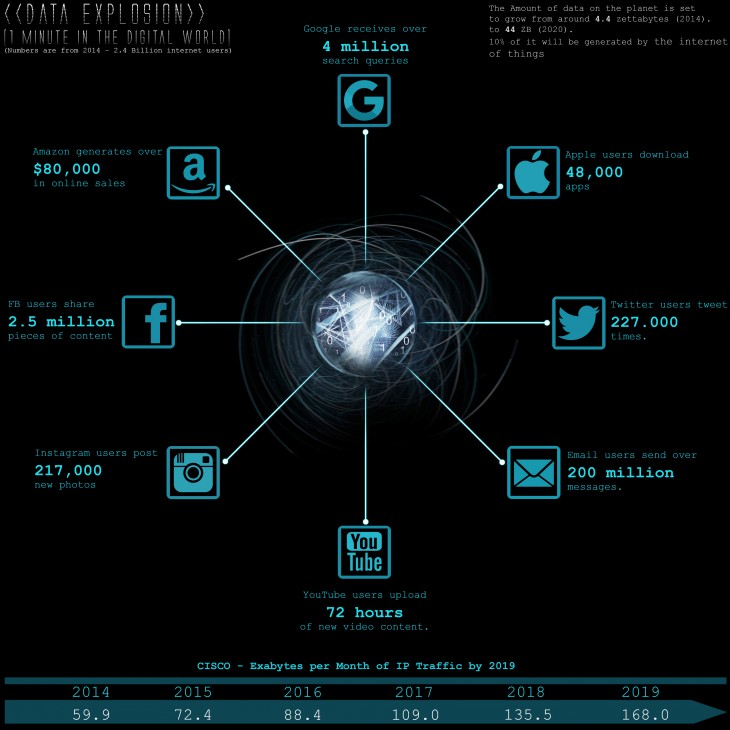
Todays data is being saved with traditional silicon-based computers.
Traditional computers are developed with silicon-based microchips. The improvement in power over the years, as well as the contraction in size of these microchips, has been predicted by Gordon Moore, Intel’s co-founder, in 1965, who said that the number of transistors incorporated in a chip, will approximately double every 24 months. This observation is very accurate regarding the fact, that technological devices such as mobile phones, laptops or TVs are constantly getting thinner and thinner but at the same time much more powerful.![]()
Cost per GB through time:
1980: 300.000,00 $
1990: 9.000,00 $
2000: 12,00 $
2010: 0,09 $
2013: 0,05 $
Following this trend and Moore’s Law it is safe to say that indeed computer chips will cost less than 1 penny till 2020.
It is possible that silicone-based computers may not continue to increase in power for much longer, but this does not mean the end of computers getting faster. The next generation may use biological molecules, like in “DNA Computing” or spintronic such in “Quantum Computing”.
While a traditional computer will just explore the potential solutions to a mathematical optimization problem, the quantum system looks at every potential solution simultaneously and returns answers – not just the best one but nearly 10,000 close alternatives as well, in roughly a second. Quantum computers transmit data using precision lasers billion times faster than today’s top processors.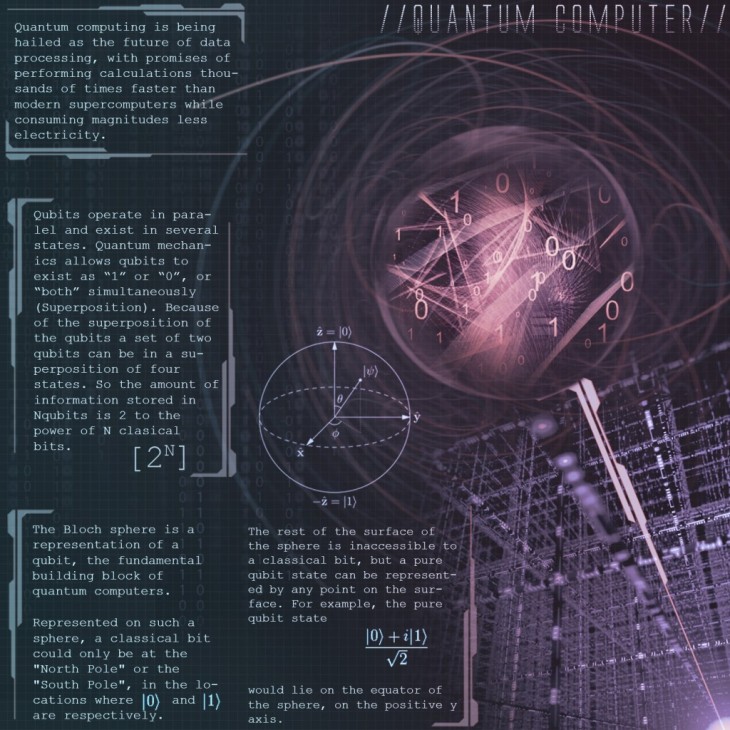
Although it is safe to say that in some day this change is going to come, this new technological era is still in the very far future. People are just beginning to learn these new programming languages. In Quantum computing the so-called “decoherence” is one major problem. Decoherence is the instability in the magnetic field, indicating that every single small disturbance will lead to a wrong output of information. These computers are also very sensitive to temperature change impeding the rapid development of this new promising technology. 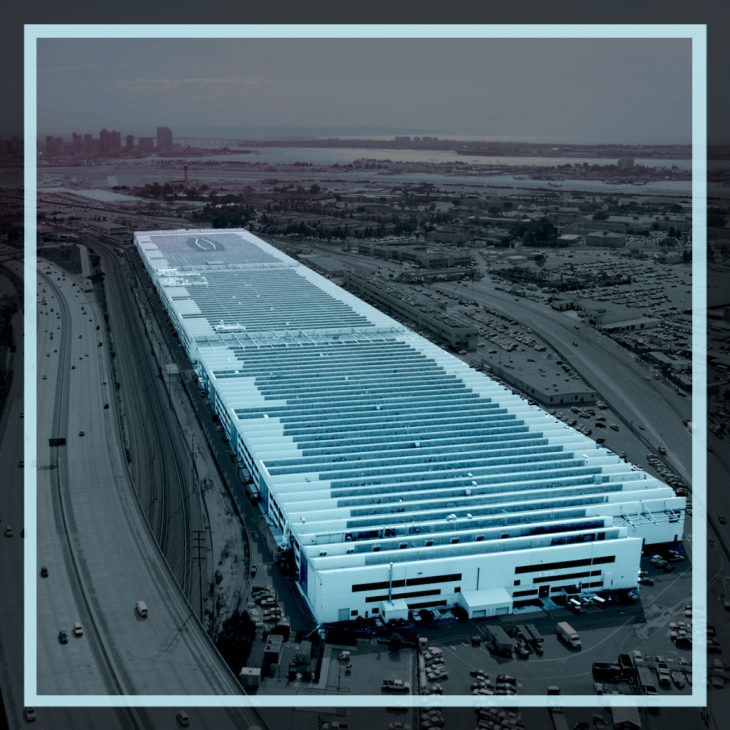
The cloud, that stores most of the data we use today is a space we never see, a space we have no physical connection to. Services like Dropbox, Google Drive, and Amazon Cloud Storage are making it easier for people to not only backup their documents but also share across multiple devices.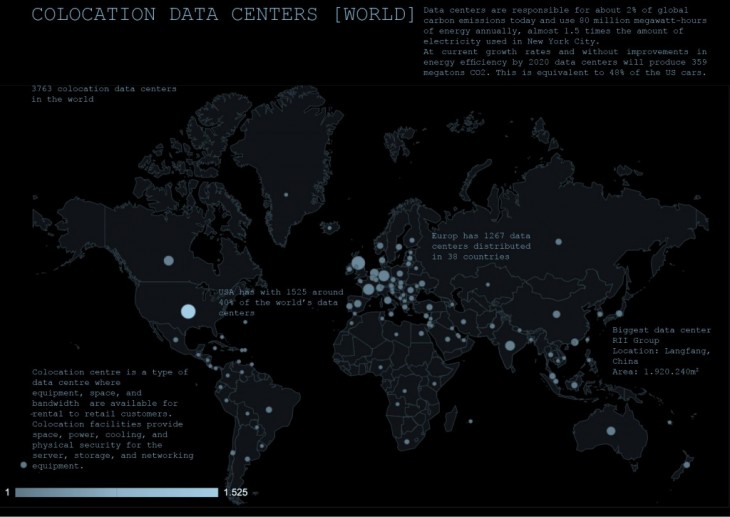
Amazon is the company with most servers. They host 1.000.000.000 Gigabytes of data across more than 1.400.000 servers. Google and Microsoft are both presumed to have about 1.000.000 servers.
The production of data is expanding at an astonishing pace. Experts now point to a 4300% increase in annual data generation by 2020.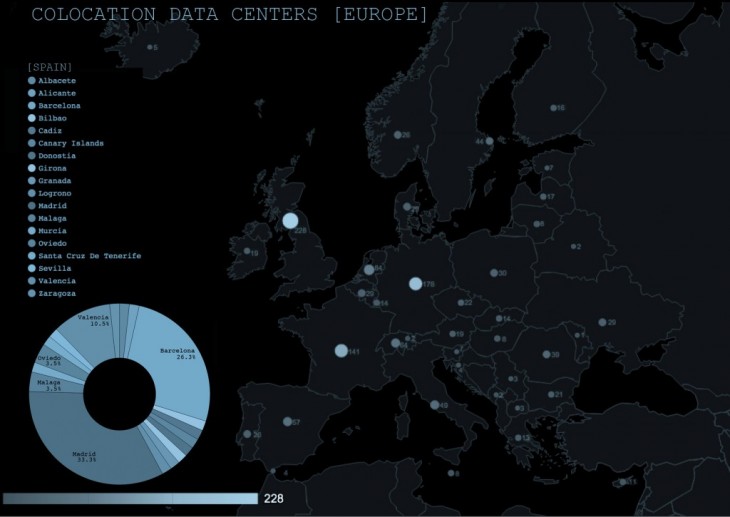
We do not have the time to wait for new technologies to arrive and rescue us from this swallowing flood of data.
We need to completely rethink the design of data centers.
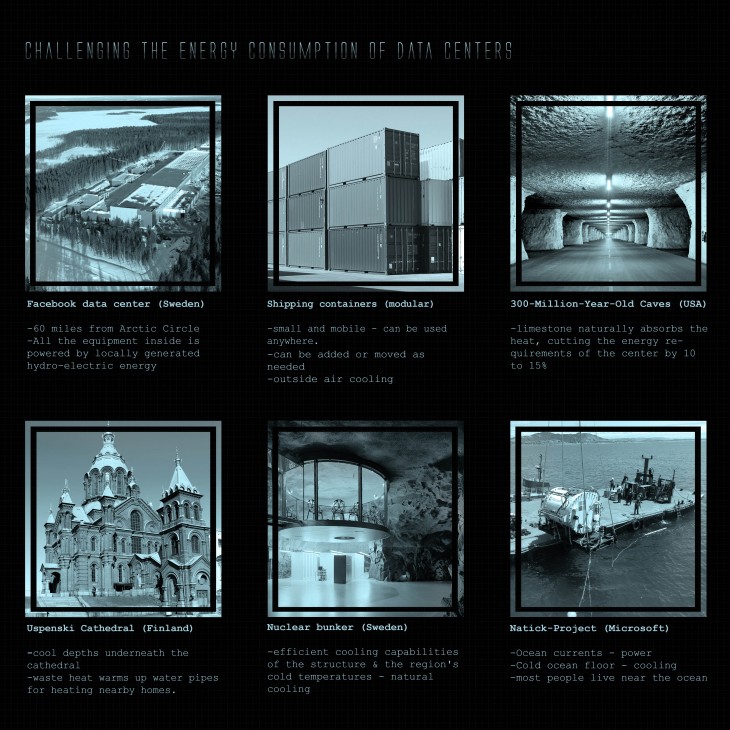
In these Examples companies try to save cooling costs by putting data centers in naturally cooled locations.
The cooling issue of the data center is just one small part of the total energy consumption of data centers.
Even if you manage to keep the cooling costs down, a data center still uses an incredible amount of electrical power to run its servers 24/7.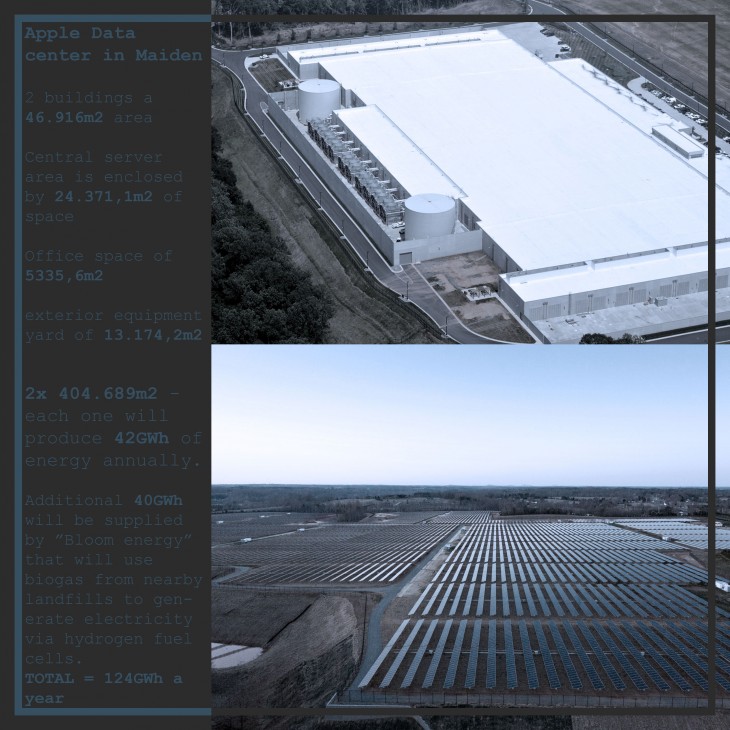
Apple claims their new “green data center” in Maiden, USA uses 100% renewable energy. A massive PV array in combination with Bloom energy fuels the data center. Regarding the images You can see that “Green” does not mean “efficient” since the PV array is more than 10 times the size of the buildings.
But why do we need data centers in the smart city?
The simple answer to that question is “L O W L A T E N C Y”
When we switch from static data to real-time data we will need a data center inside each smart city, located near the data sources, to guarantee rapid on-demand answers. When we expect sensors to communicate with the cloud to process information and return answers back simultaneously, a shorter distance is an astounding advantage for an ultrafast unruffled flow of information.
Barcelona is already known as the mobile world capital and now is also international- lyrecognized as the emerging IoT capital. Since Spring 2006 Barcelona has been welcoming each year 80.000 thought leaders, corporate giants, and entrepreneurs from around the world, for the Mobile World Congress.
How well connected is Barcelona? Where is the best location for positioning a data center?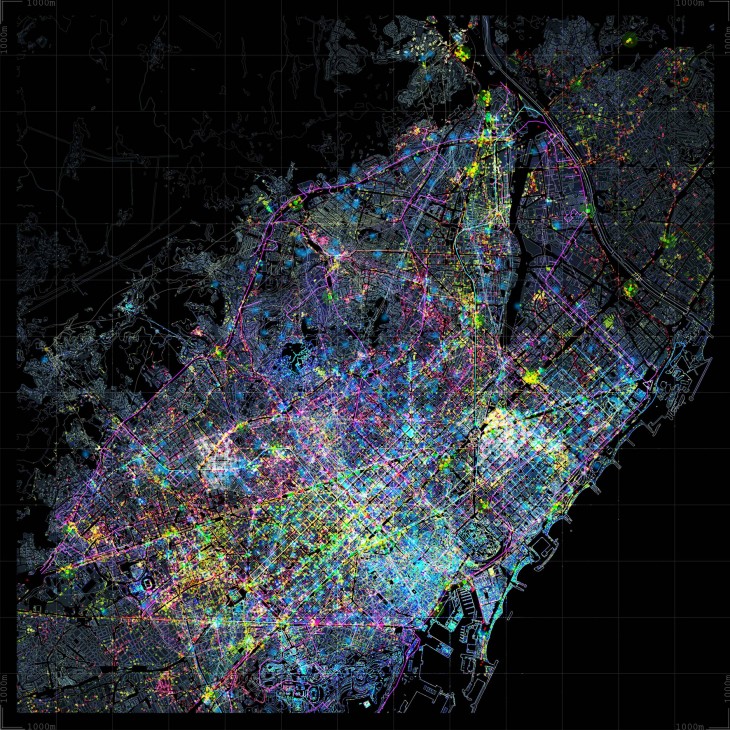
This map consists of the following layers:

3G Coverage
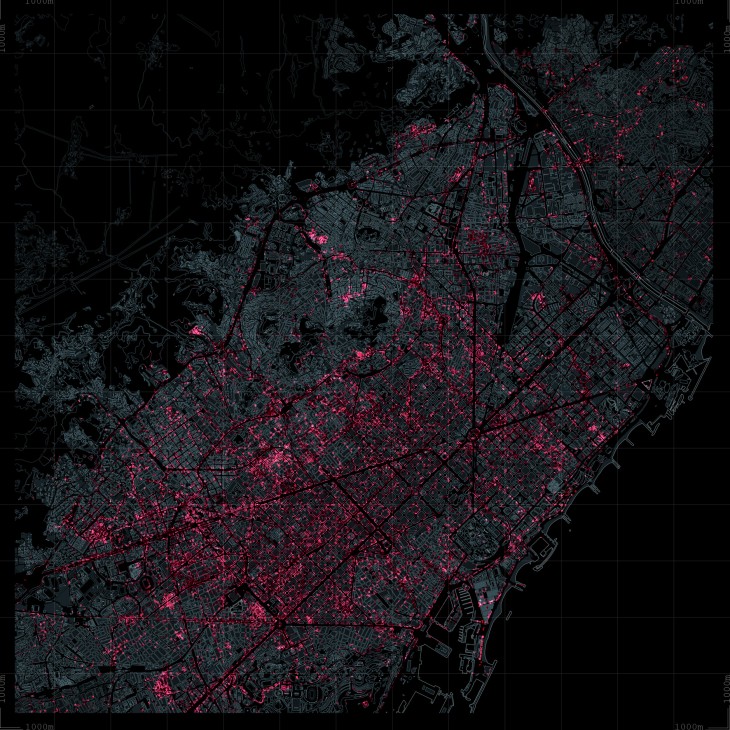
4G Coverage
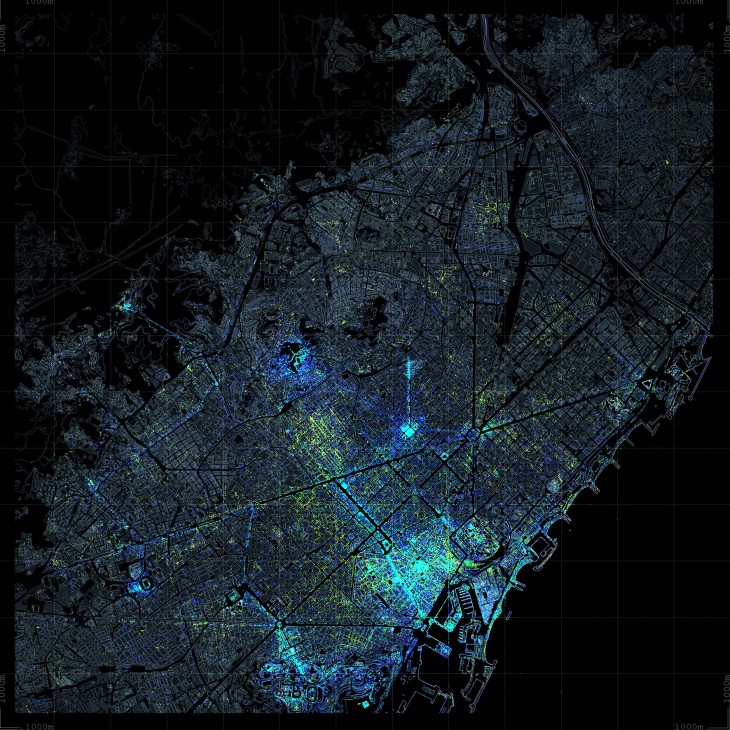
Flickr images taken from tourists (cyan), locals (yellow). Blue color – Pictures could be taken from Tourists or locals.
Search/ Analysis via hashtags can easily separate the tourist from the local.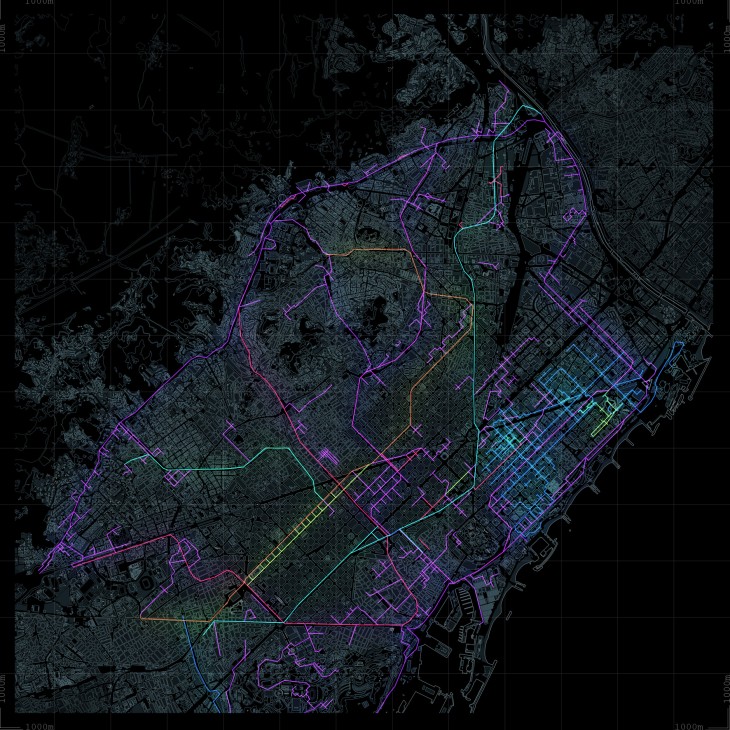
Optic Fibre Network
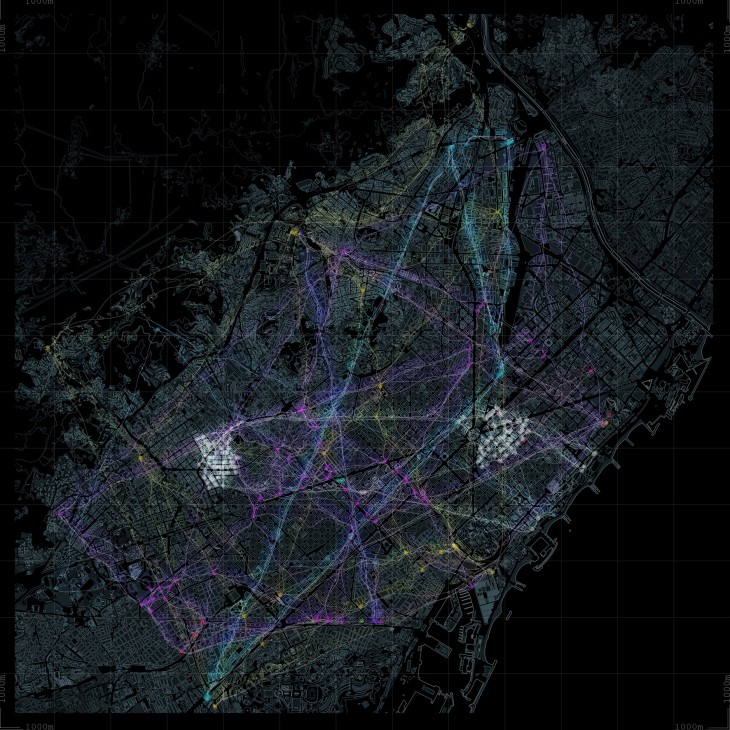
Sentilo Open Sensors Platform
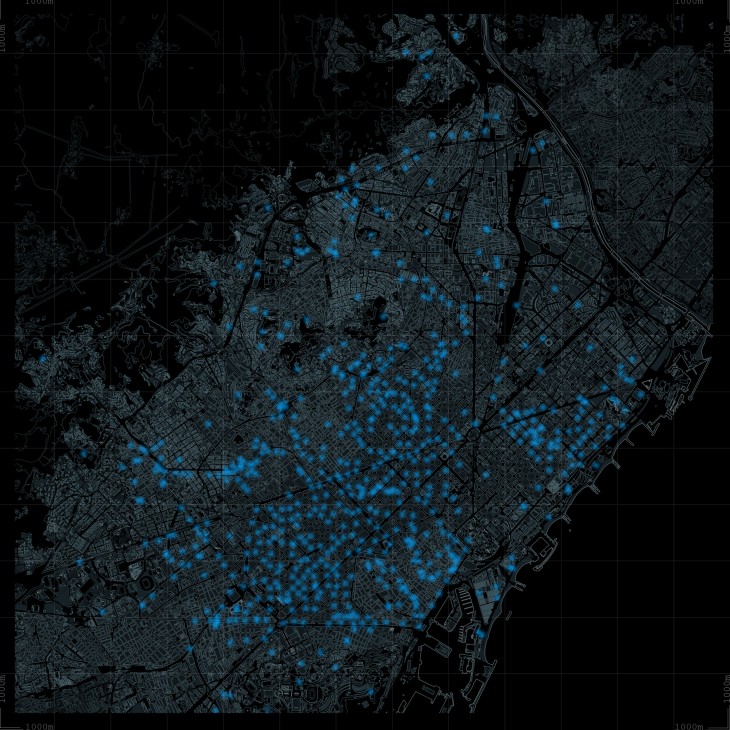
Wifi Hotspots
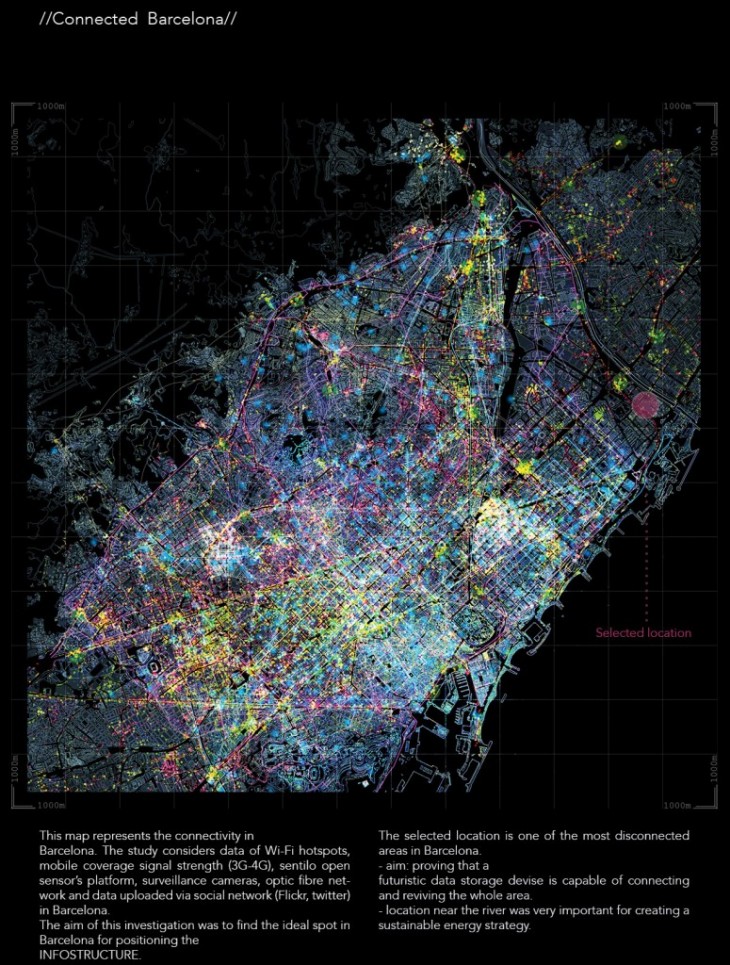
–> These maps show very well that the concentration of connections is based on the touristic central core of the city.
Case Study – Energy in Barcelona
![ddd [Converted]](https://www.iaacblog.com/wp-content/uploads/2016/06/dataceters-730x730.jpg)
Data centers (red) and the supercomputer (yellow) in Barcelona
In the metropolitan area of Barcelona, there are 3 main types of energy infrastructures: The electricity grid, infrastructures related to natural gas and those related to oil products. The management of these infrastructures is regulated by the Government of Spain and the Catalan government, and it is carried out by various companies, such as Ele?ctrica Espan?ola, Enagas or Compan?a Logistica de Hidrocarburos (CLH).![ddd [Converted]](https://www.iaacblog.com/wp-content/uploads/2016/06/hv-electricity-network-730x730.jpg)
High-Voltage Electricity network
In the metropolitan area, the electricity network consists of a transport grid dominated by sec- ondary transport lines of 220KV, with a very lim- ited number of primary transport lines of 400KV. The main nodes of the 400 KV network in the vicinity of the metropolitan area are Sentmenat and Rubi, and the only 400KV substation lo- cated within the metropolitan area is the one from Begues. A 220KV network articulates from these nodes, with the main objective of bring- ing energy to the main consumption points, from which it is distributed through a medium voltage grid (mostly 25KV).
[A?rea Metropolitana de Barcelona]
![ddd [Converted]](https://www.iaacblog.com/wp-content/uploads/2016/06/energy-generation-730x730.jpg)
Energy generation research
Energy production plant of the port of Barcelona composed of two groups, Port Barcelona 1 and Port Barcelona 2, with installed gross pow- er of 447MW and 445MW. It is operated by Gas Natural Fenosa.
The plant of Beso?s consists of three groups, Beso?s 3 (419.3 MW) and Beso?s 5 (873.3MW), which are operated by ENDESA Generation, and Beso?s 4 (406.6MW) operated by Gas Natural Fenosa.
They have jointly a total gross power of 2,590.8MW. In 2011 they generated 6,182GWh. Concerning to OR-Ordinary Regime, the main production facilities are Eco parks, the energy recovery center of PIVR (Waste recovery Integral Plant) of Saint Adria? de Beso?s, the old tank of Vall d’en Joan landfill and the energy generation plant of Zona Franca.
The TERSA-Sant Adria? de Beso?s Waste-to-Energy Plant produces 207.414MWh of electricity. Photovoltaic project of Forum:
The total PV-power installed on site is 1,3 MWp. It can cover electricity consumption of app. 1.000 Barcelona households using 1.900 MWh/ year. The solar pergola by itself is 5600m2 big and has an electricity output of 450Kwp. The Central Esplanade PV-array produces 850 Kwp.
Red Electrica Espan?ola (REE) is responsible for transmitting the electrical energy through the network to supply various agents and carry out international exchanges.
[A?rea Metropolitana de Barcelona]
![ddd [Converted]](https://www.iaacblog.com/wp-content/uploads/2016/06/site-730x730.jpg)
Site Location (yellow area)
Solar Analysis of the site area:
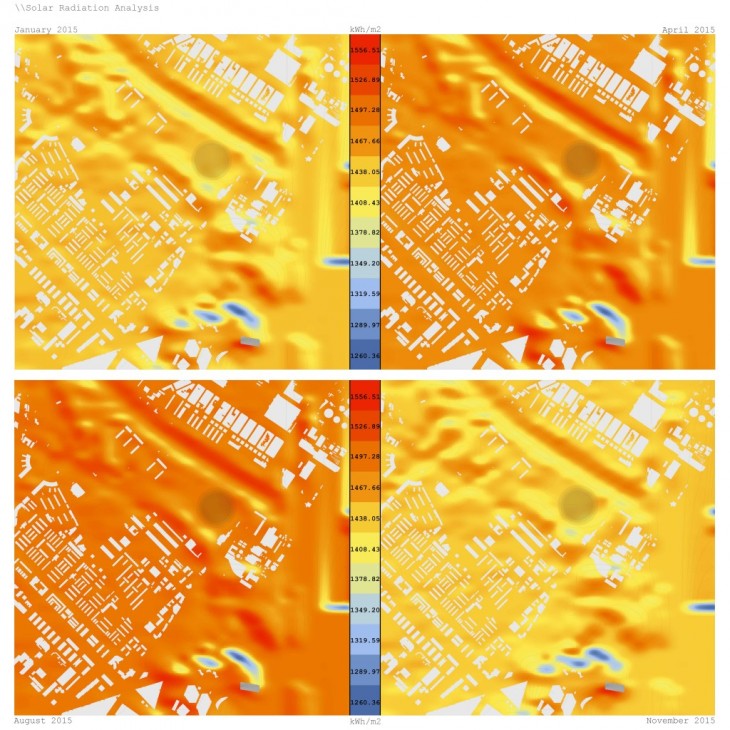
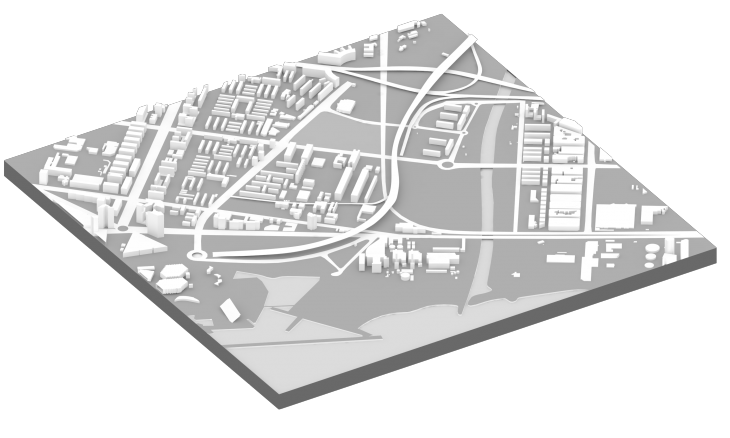
Site model –
The first design stage of my urban approach was to open up this are to the rest of Barcelona. To do so I needed to “Jump over” the Ronda to blur this artificial border. This whole area of Saint Adria de Besos has an enormous potential to be inviting for tourists and locals.
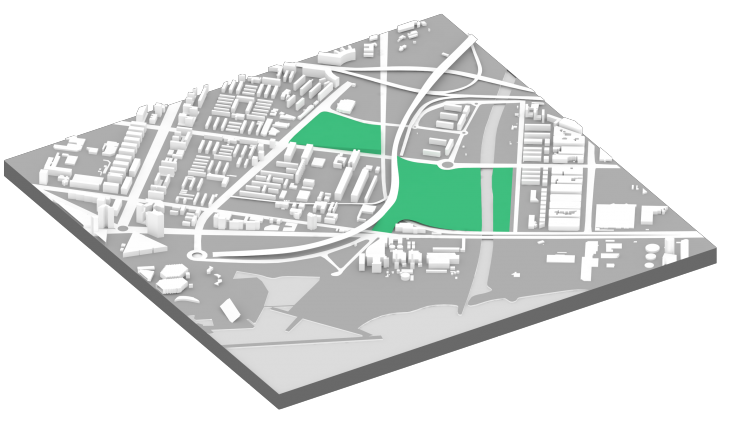
Rising the green areas –
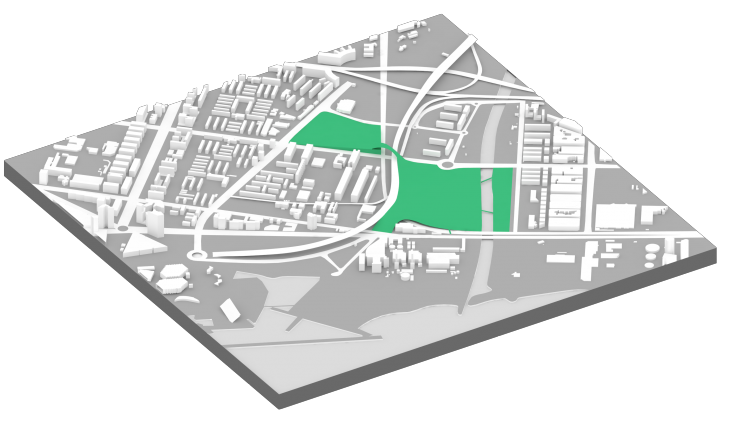
To revive the whole area and give more value to the location I created a green space that goes up like a hill towards the street. This landscape modification will visually erase the unrepresentative highway.
Connecting the green areas –
The next stage envisioned the connection of the plot with el Parc del Besos, “jumping over” the highway in order to create the biggest green space in Barcelona. This would invite many people to the area.

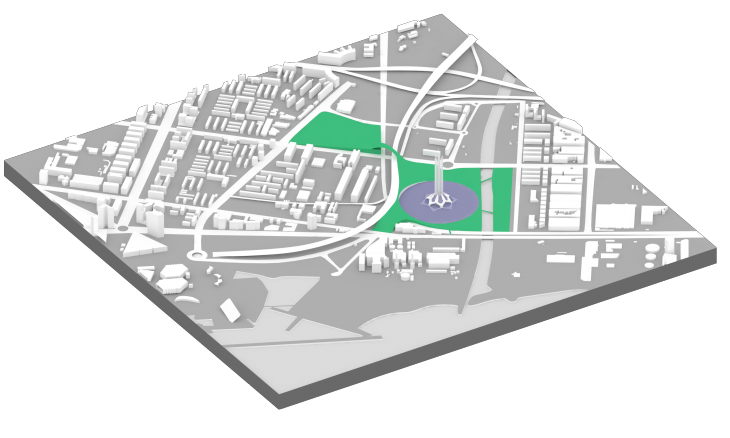
Introduction of Solar Updraft Tower as the main energy supplier for the self-sufficient data center –
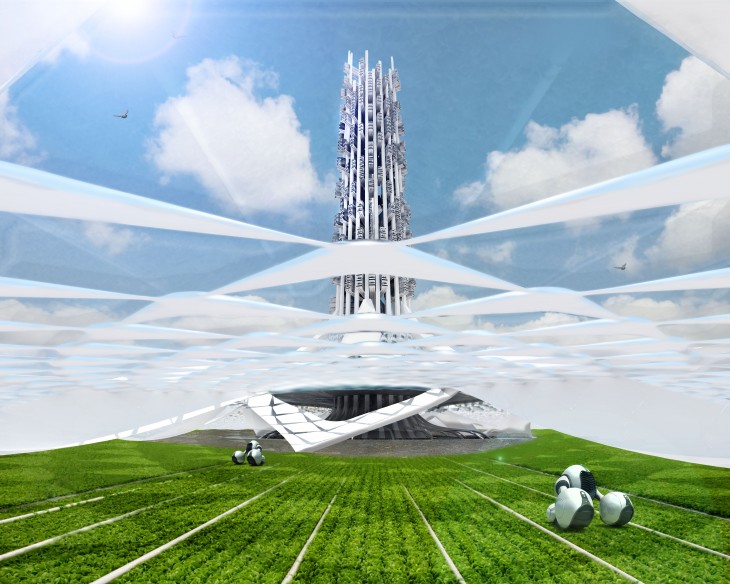
The core of the data center consists of a 200m high chimney and a greenhouse structure with dimensions of 150 m radius. This combination of chimney and greenhouse is used in solar up- draft towers to create natural energy.
Outer Construction-
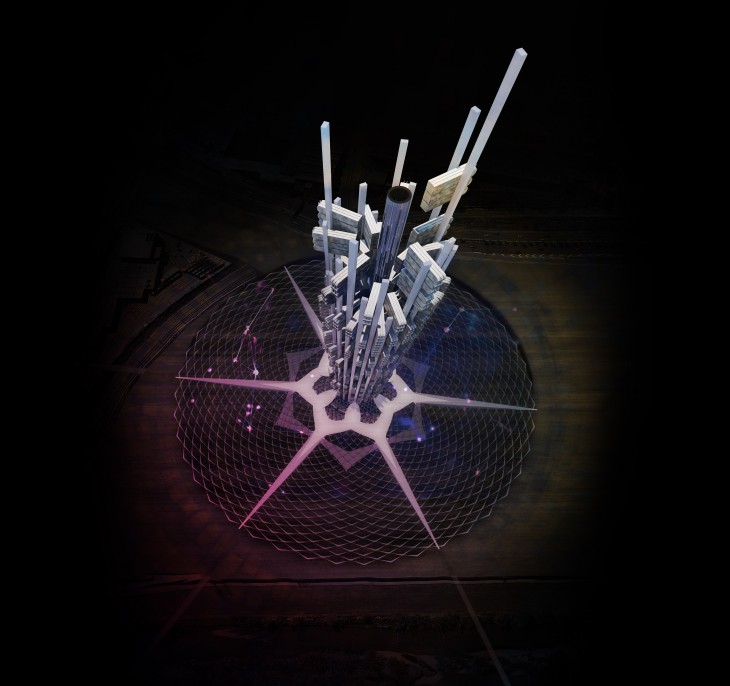
The next step was to create the outer structure of the data center. I envisioned the data centers as modules (standard container dimensions) attaching on the outer structure. A robotic arm could move on the chimney placing the data centers in position.
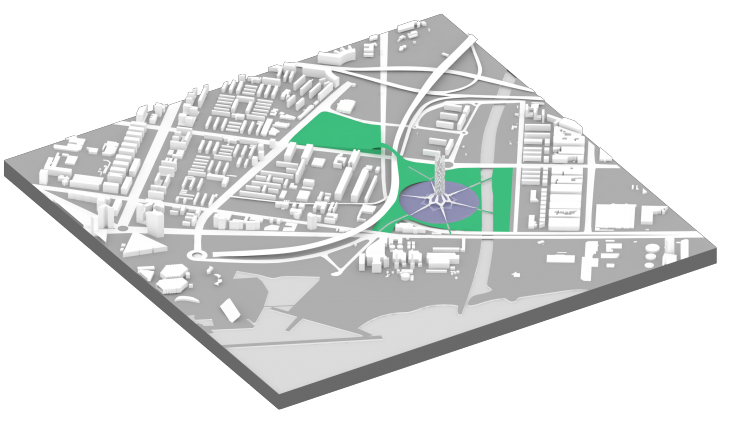
Modular data center and bridges allowing people to interact with the data center
This modular structure can grow over time when more storage capacity is needed without starting from scratch and building a new structure. This technique is very useful in dense cities where you do not have unlimited space. Six bridges function as entrances to the data center.
Can a data center be self-sufficient?
Is there a single best strategy for creating an off-the-grid self-sufficient data center?
The strategy that I developed is a multiplication of different formulas working together to achieve self-sufficiency. Self-sufficiency is much more than just energy-efficiency. A self-sufficient building can supply itself with all resources it needs within its own structure.
So in this case to create the future of data center design, energy-efficiency was just one aspect of the design challenge.
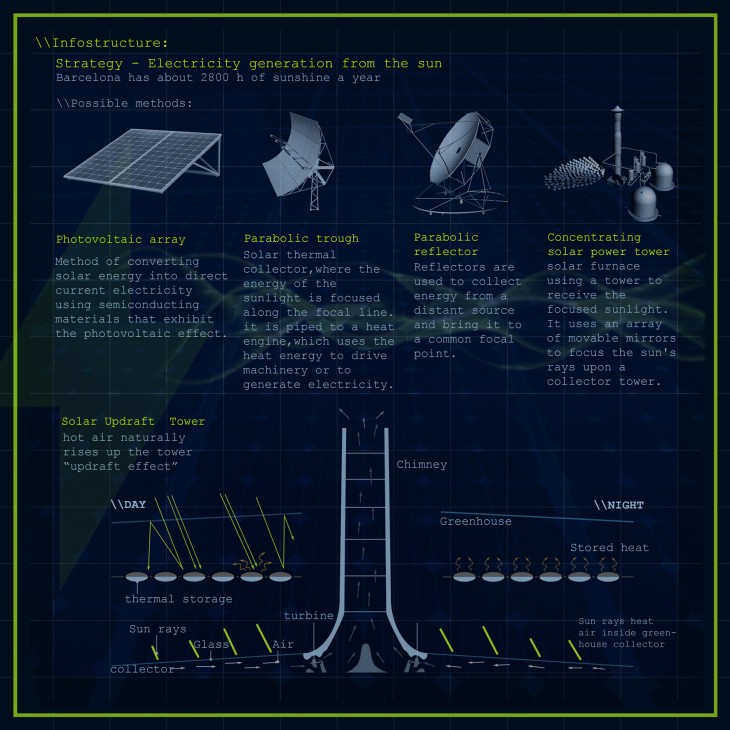
For my energy efficiency strategy I chose to combine transparent photovoltaic panels and a solar updraft tower. Both systems will use the sun as a renewable energy source.
Barcelona has about 2800 hours of sunshine each year. But using the sun’s energy as the primary renewable energy source has one major problem; to find an affordable, reliable way to store the electrical energy created by solar installations. Rechargeable batteries are the storage option that is most used particularly for storing energy in off-grid solar systems. Batteries are very expensive, they require a surprising amount of maintenance and they have a relatively short lifespan.
 To meet this energy storage challenge, research labs around the world are using Hydrogen as a storage medium in an innovative way to the sun’s energy. Hydrogen as an energy storage element is very reliable since it has a much longer lifespan than batteries.
Hydrogen is the simplest and most basic of all elements. Hydrogen in its pure form is an excellent fuel. As a primary component of water, Hydrogen exists everywhere around us in a seemingly endless supply.
Even though Hydrogen offers many poten- tial advantages, increasing its widespread use has many challenges. The first and most diffi- cult challenge is to obtain Hydrogen in its pure form because Hydrogen is almost always found in nature bound to other elements.
There are a few ways to separate Hydrogen.
1. Hydrogen can be derived from natural gas in a process called steam methane reforming.
2. Hydrogen can also be produced by using coal in a process called gasification.
3. One of the most promising and environmen- tal-friendly ways to obtain Hydrogen is by elec- trolysis, which uses electricity to split water into Oxygen and Hydrogen.
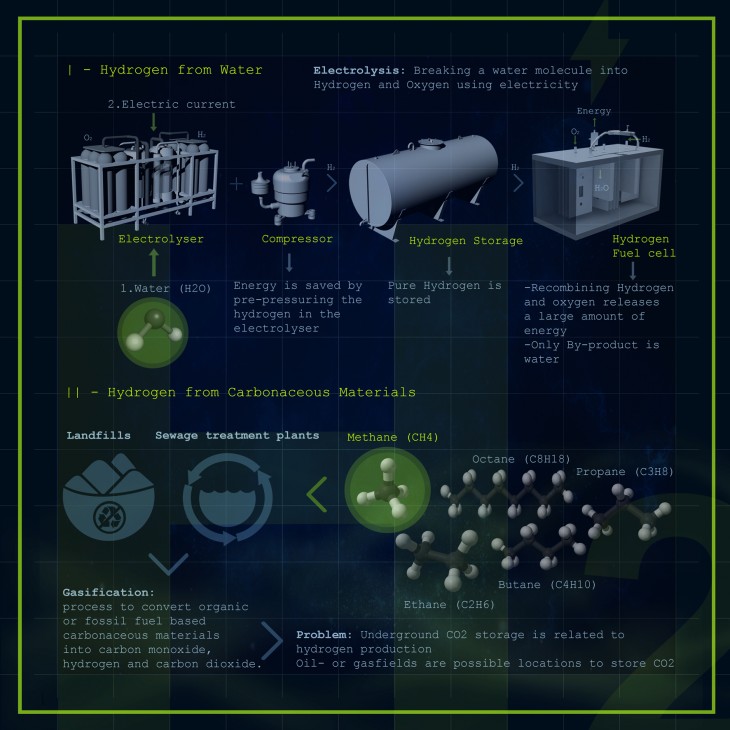
References for the Data center’s structure and energy production.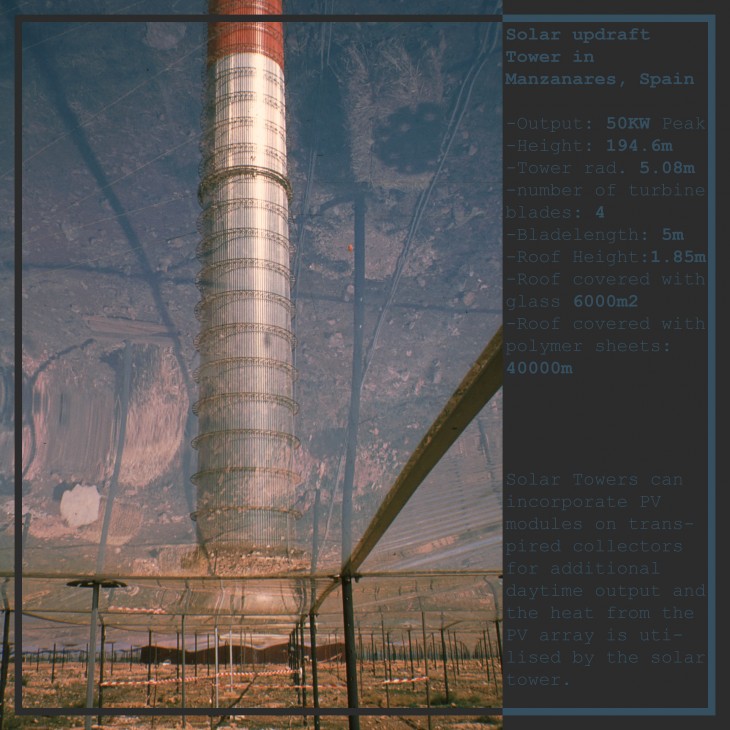
Solar Updraft Tower Reference – Manzanares, Spain
The Solar updraft tower in Manzanares was a test- ing prototype. The tests were very successful but the use of cheap materials resulted in decommissioning the tower in 1989. The tower’s guy wires were not protected against corrosion so they failed due to rust and heavy storm winds.
Wolfsburg Car Silos as a reference for the interior structure/mechanism
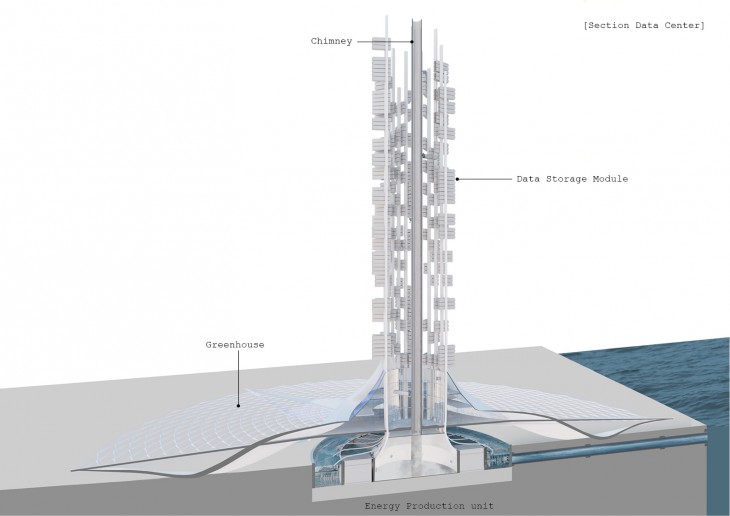
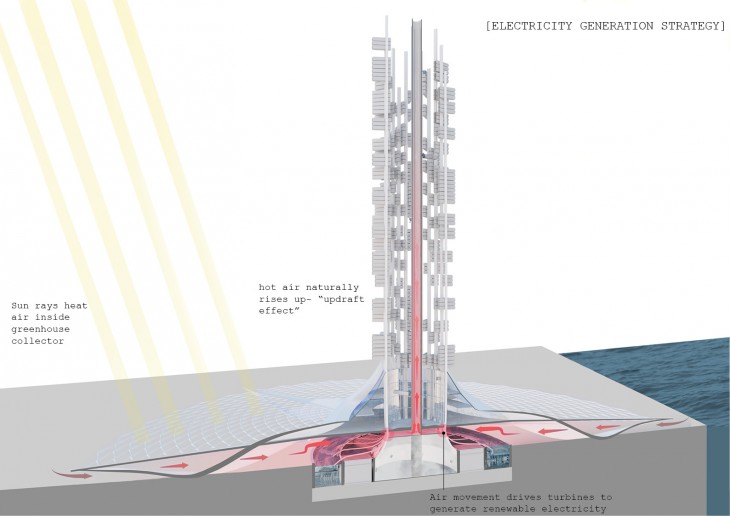
1. SOLAR UPDRAFT EFFECT
Sunshine heats the air beneath greenhouse roofed collector structure surrounding the central base of the tall chimney tower. The resulting convection causes a hot air updraft in the tower by the chimney effect. This airflow drives wind turbines placed around the chimney base to produce electricity. Of course the electricity output of this system is not enough for supplying the data center by its own. The increase in tower height results in a larger energy output.
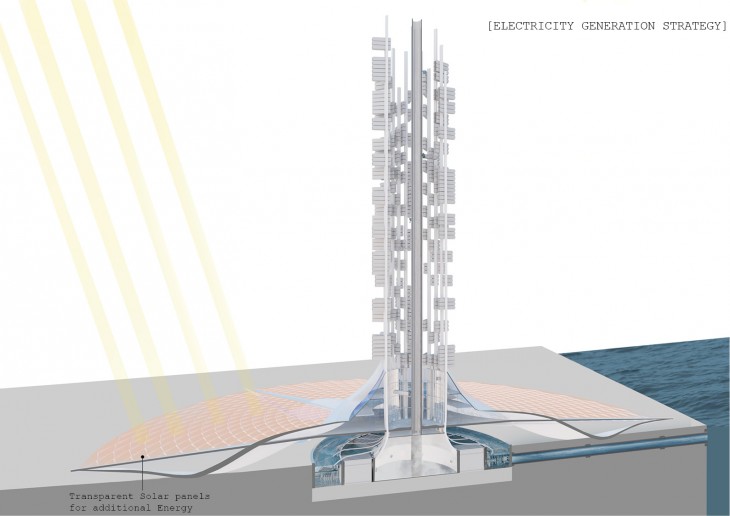
2. TRANSPARENT SOLAR PANELS
Photovoltaic systems operate at about 15% efficiency – the remaining 85% is mostly turned into heat, which is wasted on nearly all current PV systems. The heat is not only wasted but it causes the PV panels to run hotter, which again, lowers their efficiency. In combination with the solar up- draft tower, it is possible to harvest the emitted heat because the greenhouse functions as a “solar wall” sucking the heat from the solar panels and running the hot air through the turbines at the tower. In this way, the solar panels will work very efficient providing a much higher energy output with minimal losses.
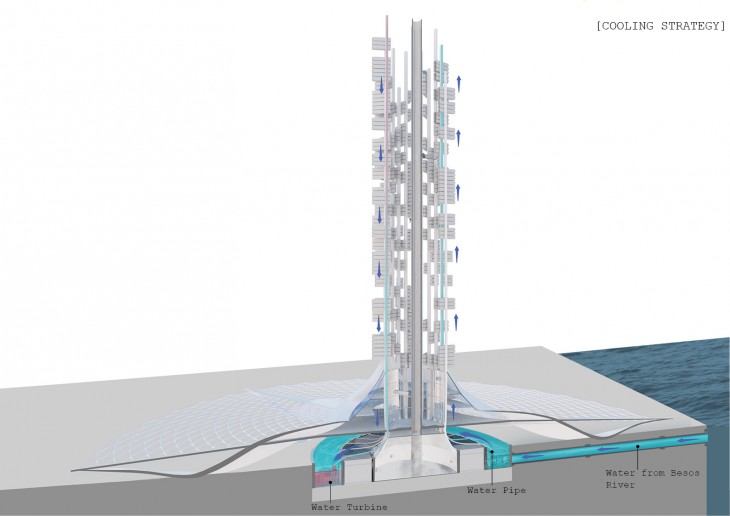
3. LIQUID COOLING
Water is being taken from the nearby Besos rier. This water is pumped up to the modules to cool the hot parts directly in the servers. After cooling the server the water drops down to the pool in the bottom ensuring the turbines under- neath to spin and provide energy for pumping water up to the tower. After the initial push, this circulation of water continues without the need for extra energy. Liquid cooling reduces cooling energy by more than 50%. It increases data center density by more than 250% end enables recycling of 100% of the heat removed.
Most of the heat in a data center is generated by computer chips, CPU’s, GPU’s and memory modules, which consume a tiny fraction of the total space in a data center and within individual servers.
– Air-cooling waste energy: -15% of total data center energy is used to move air
– Fans are inefficient and generate heat that must be removed
– Air-cooling wastes space
– Air-cooling reduces reliability
– Air-cooling is expensive
– Air-cooling limits power density

4. ELECTROLYSIS
Again water from the Besos river is needed for getting water to the second pool with the electrolyzers. The water is being electrified in order to split the water molecules into Oxygen and Hydrogen. Oxygen is released to warm up again and run through the turbine a second time. Hydrogen is being injected into the massive storage where it can stay for a very long time. This strategy is very useful for modular structures because only the needed amount of energy is released to reach the target modules via the main pipes, the rest of the energy stays secure in the form of gas inside the storage tank.
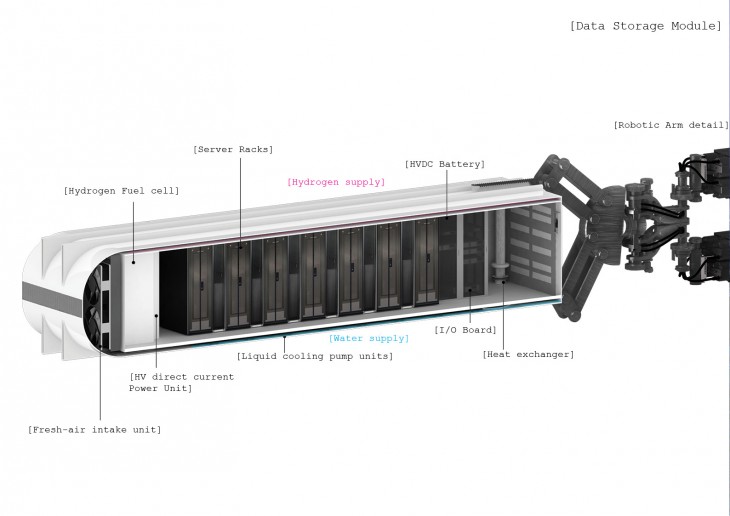
MODULARITY
The biggest design challenge was to create a modular design structure that is able to grow over time since data is constantly growing. The key was to create each module as a separate data center with its electricity generator located next to the servers to ensure a minimal electricity loss. In this way, no empty space is cooled or charged with electricity. Six robotic arms can constantly move the containers up (adding new modules) or down (for maintenance).
Hydrogen as an energy storage medium is very reliable since it has a much longer lifespan than batteries and it can store energy in the form of gas and transmit it easily just to the modules installed. Inside each container, electricity is generated via a hydrogen fuel cell providing electricity for the servers. The same principle is envisioned also for the cooling strategy. The installed servers will be directly cooled with water gained from the Besos river.
The data module is a complete data center with its own power source and cooling unit.
The dimensions of the containers differ from 40ft. (12m length) for 7 server racks and 20ft. (6m length) for 3 server racks.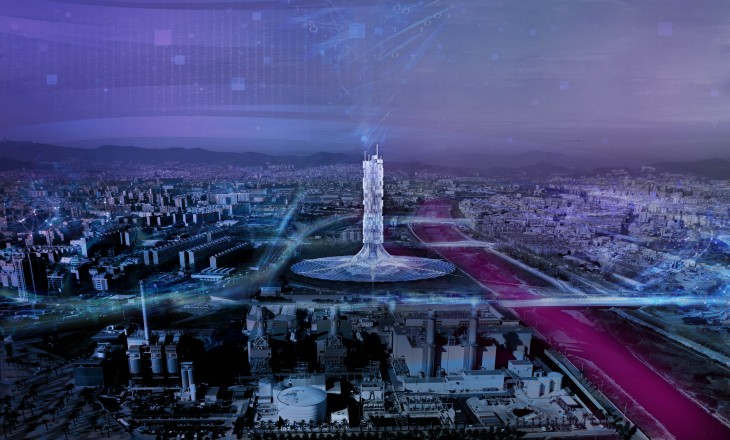
To create more value for the project and guarantee its utilization for decades, I had to create a multi-functional space that is not dependent on its current assignment, a space that can easily transform over time. Today it is a data center and tomorrow it can easily be transformed into an apartment building, office building or hotel enjoying the best views of the city. Maybe, in 50 or 100 years data will be stored via bacteria that do not need enormous spaces for storing the endless amount of data. This container architecture is very useful since containers can in- habit any space needed. Data center units can easily be converted to residential units.
>[Infostructure][housing the digital realm] is a project of IaaC, Institute for Advanced Architecture of Catalonia developed at the Master of Advanced Architecture MAA02 [2014-2016] by:
Studend: Borislav Schalev
Faculty: Vicente Guallart // Ruxandra Bratosin
