Are we really aware of the whole process involved every time we turn on the faucets?
According to the OMS, we should use between 50 and 100 liters per day to have a more equitable distribution of this vital resource on the planet.But do we know how much water we spend daily each time we shower, wash, drink, or use the bathroom?
Thanks to the computational tools, it is possible to count and visualize the current water consumption. The assumption of this project is that all roofs in a city could be supplied with infrastructure to capture, gather and distribute water. So let’s use Rinnho and Grashopper to visualize and simulate
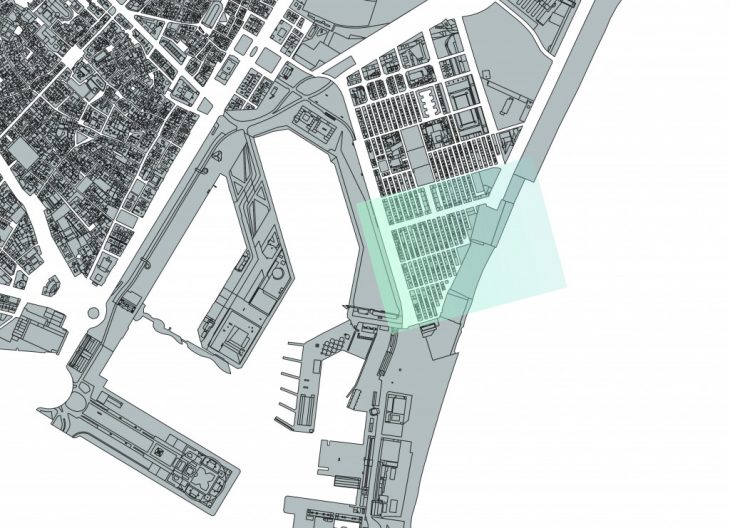
Using one specific area of La Barceloneta in Barcelona, A dynamic model was created that visualizes current consumption and simulates the collection of rainwater using an “umbrella” system that replaces part of this demand.

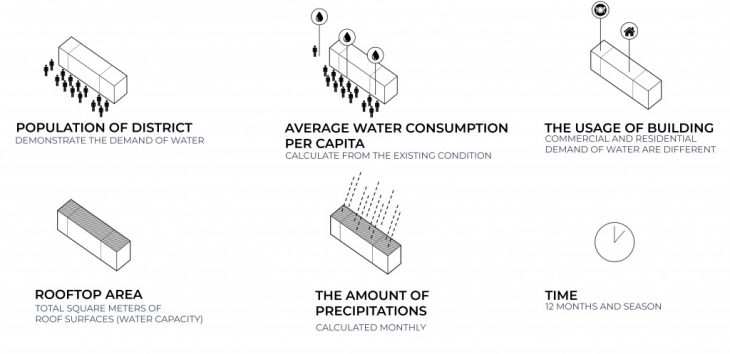
Considering the population and average water consumption per capita per month, total square meters of roof surface, the amount of precipitations for each month and the usage of building, a csv was created with the geolocation of each building in the study area.

The goal was to merge metadata from existing shapefile and created csv. Using Grashopper Finally the most accurate posible scenario was obtained.
Then each geometry reads the data directly from the point to which it belongs.
This model was created in a total of one year, since rainfall varies according to the season as well as the demand for water per capita.
As for the design of the collection system, the umbrellas represent a double roof that captures and stores water.
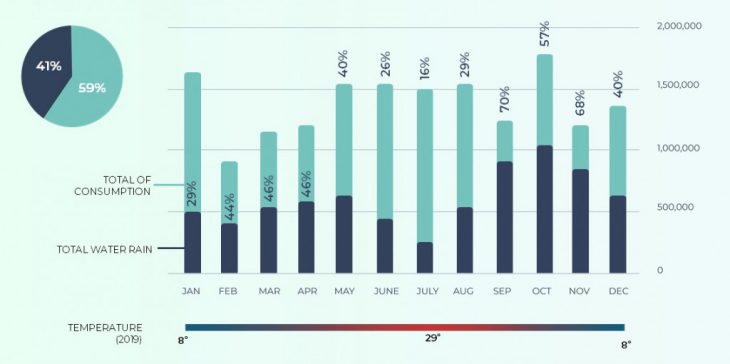
This system depends on the rainy seasons and total consumption. Here we can see the relationship between the current water consumption per month in this specific study area and the percentage of that consumption that can be replaced by just taking the rainwater from rooftops.

But how can we communicate to the user?
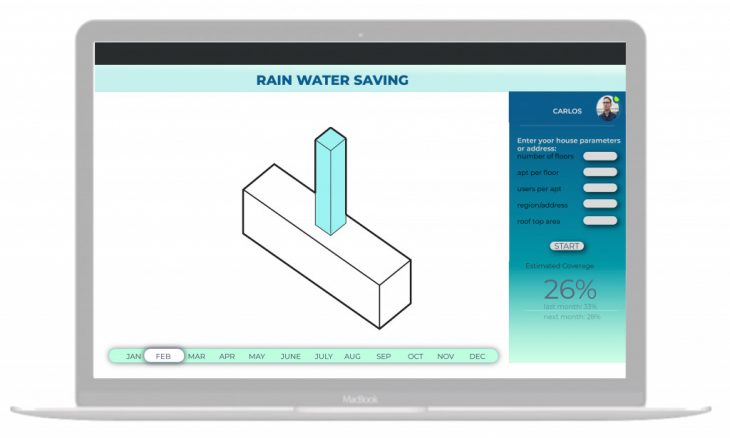
In order to calculate water consumption user has to insert its building parameters like number of floors, apartments, inhabitants and region, or just simply insert the address. And then just move slider through the months.

However, these strategies only help optimize the existing consumption system, we will not be able to satisfy all the demand for water yet, so even with all efforts, the message is to be aware with the daily consumption, and the decisions we make, without it the efforts will always be insufficient.
More Rain More Gain? is a project of IAAC, Institute for Advanced Architecture of Catalonia
developed at Computational Design II in 2019-2020 by:
Students: Linara Salikhova, Pawitra Bureerak, Rashid Gilfanov, Michelle Rodríguez.
Faculty: MACT I