 fig.01 source: new york times.- window-washing-new-york-dangerous
The following project aims to prevent accidents in buildings by proposing a cleaning robot machine and predict it’s cleaning time.
Workflow
Currently the workflow consist in:
- Train a DQN model
- Data extrapolation and sinthetic data creation .
- Data exploration
- Train and test Shallow learning models.
- Test and train ANN regression
- Finally understand best options to predict time
 fig.02 workflow graph
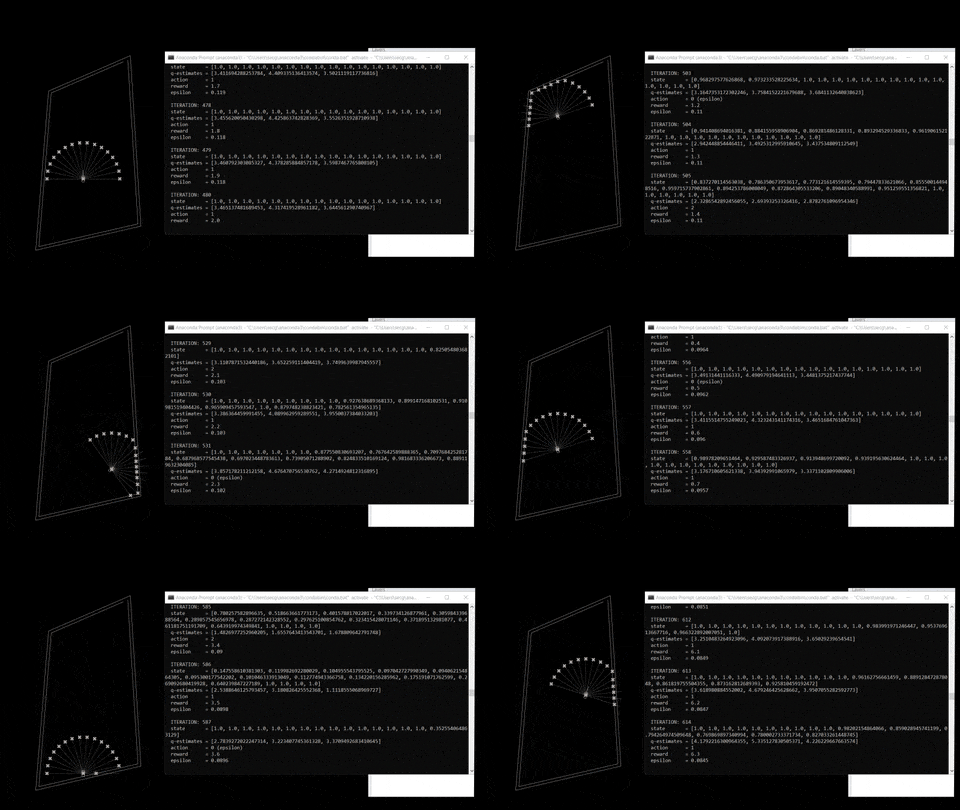
DQN learning is a process that involve experience, replay and uses a random sample of prior Action to generate rewards in a certain environment.
fig 03. Training process and reference repo.
https://github.com/NariddhKhean/Grasshopper_DQN
The training process is based on an input, agent and output. Outputs consists in a expected return (Action “behaviours” + state “observations”). Here are the following steps:
- Initialize the agent
- Run a policy until termination
- Record all states, actions, rewards
- Decreace probability of actions that resulted in low reward
- Increase probability of actions that resulted in high reward
After training the agent we extracted features to extrapolate and build our synthetic data, which consist in a 4 sided window with different sizes.
Data Exploration
Most of explorations were made with numerical values, only test a couple of samples with categorical values. Finally chose a dataset with numerical values of 5000 samples, which in this case had a better performance.
fig 04. 5000 samples dataset
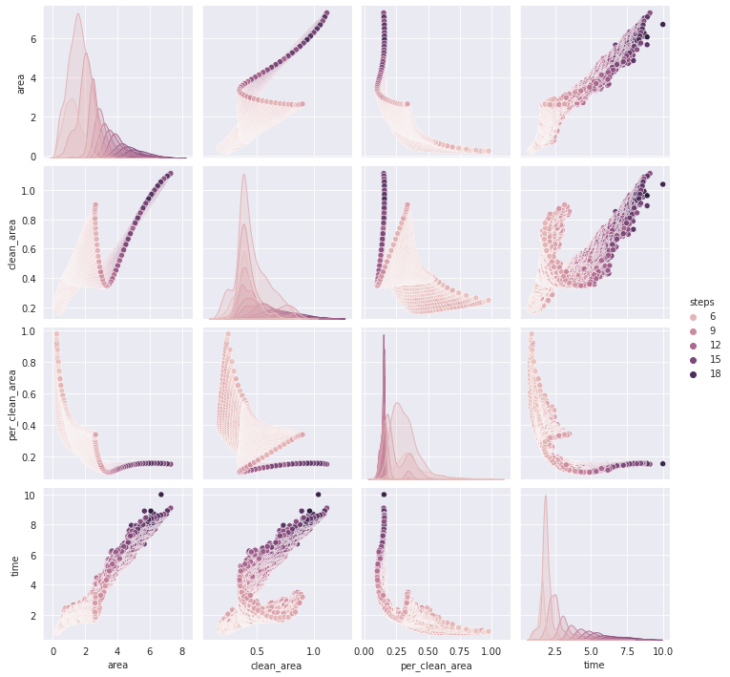
For the first data exploration we tried to split the data based on boolean values to understand the relation between classes. Then we simplified our columns based only in numerical values and without any geometrical feature that could create unnecessary noise.
fig 05. Pairplot numerical values
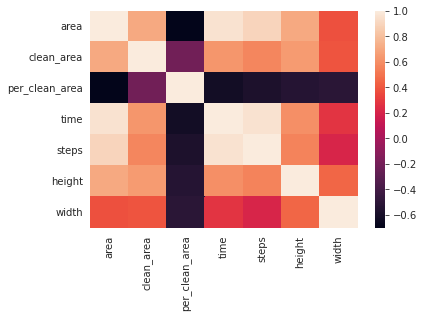
fig 06. Heatmap numerical values
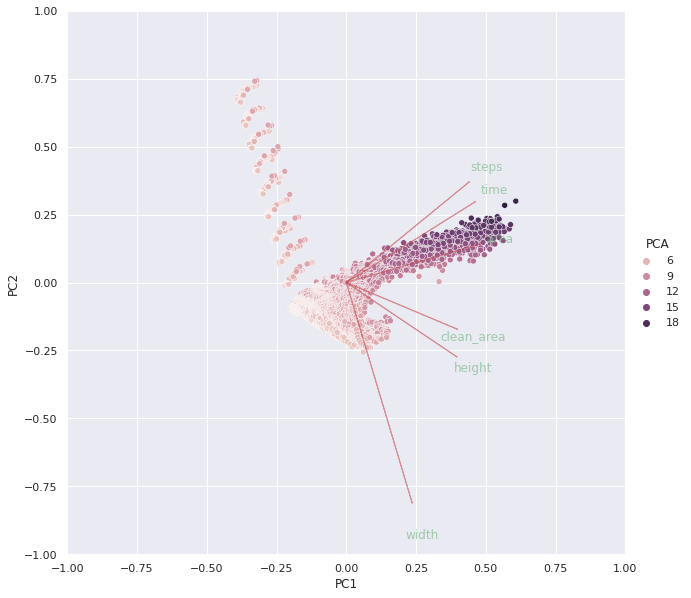
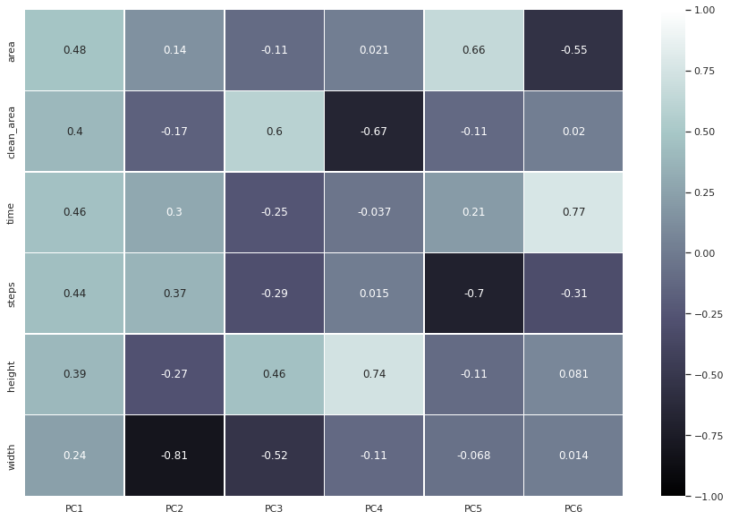
Then we runned our PCA Analysis where width in some point is a relevant feature but no necesary have some directly relation between the other features. Steps, area and time seems to have a more directly relation the same between clean area and height.
Down below you’ll find the best scores from PCA Analysis:
- PC0 – area
- PC1 – width
- PC2 – clean_area
- PC3 – height
- PC4 – steps
- PC5 – time
fig 07. PCA analysis
fig 08. PCA best scores
Learning Process
Then during shallow learning try outs, we test linear regression where we had a performance of 0.9679, XGB regressor with 0.9871 and finally polynomial kernel degree 3 with 0.9850.
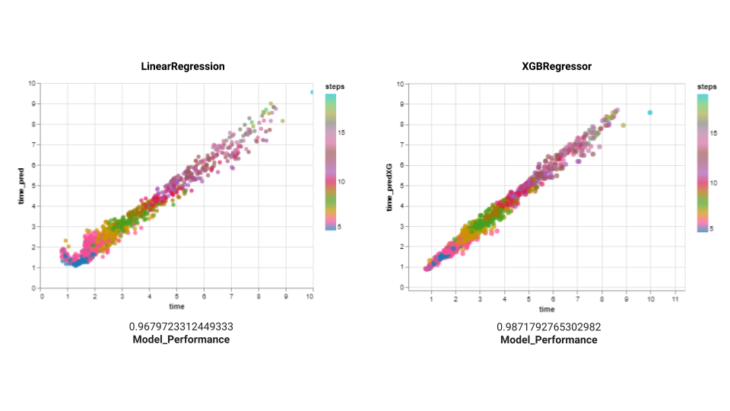
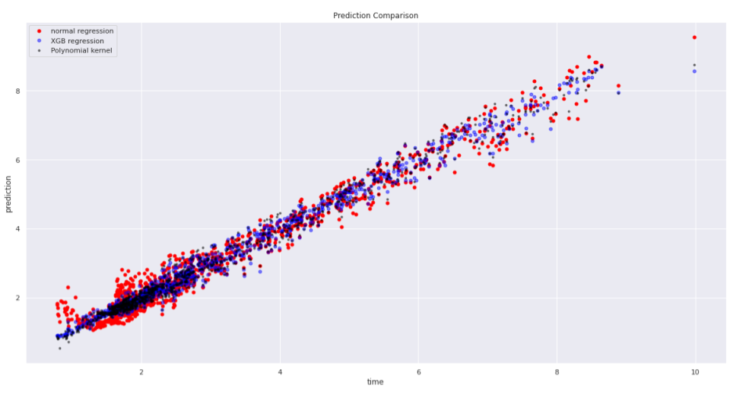
fig 09. Comparative plot between regression, xgb and polynomial kernel
For ANN regression we runned the model with 113 params and had a MSE loss of 0.0005. Most of the learning happened during the first epochs and then stabilized.
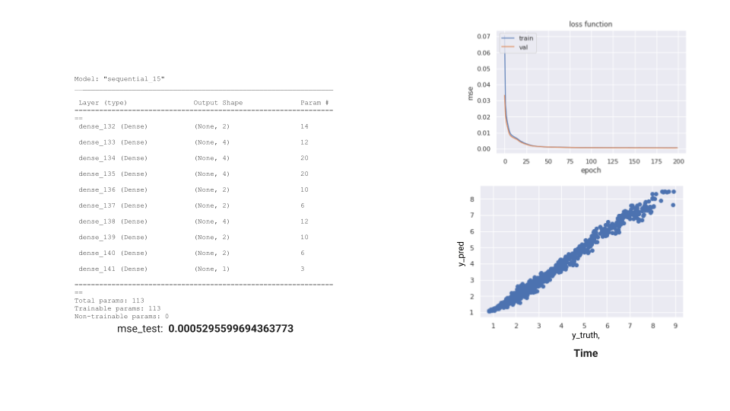
fig 10. loss function plot
Deployment
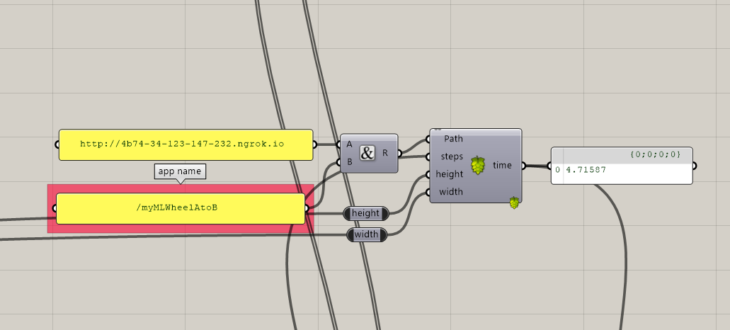
During the deployment in gh we tested with 59 params and 20 epochs with a MSE loss of 0.036. Here, we might experience a different problem to the one presented before, as a low number of parameters might result in unreliable predictions. This can be solved by building a new model with better configuration alternating layers sizes.
fig 11. GH deployment + cleaning time prediction
After these observations, we concluded that the first ANN regression model and, therefore shallow learning, was showing the best performance, for which this was used to conclude the last steps that have been presented.
This model would allow the user or client to get a reliable prediction of the cleaning process in relation to his/her building.This information could be integrated into AEC schedule and help predict from the very beginning not only the cleaning times for a building but the numbers of robots that will be need and the related expenses.
fig 12. Facade + NEO cleaning machine
Credits:
NEO.- Cleaning Machine is a project of IAAC, Institute for Advanced Architecture of Catalonia developed at Master in Advanced Computation for Architecture & Design in 2021/22 by:
Students: Irene Martin and Salvador Calgua
Faculty: Gabriella Rossi & Hesham Shawqy
