 This research is the final thesis for the Masters in Advanced Computation for Architecture & Design at IAAC (Institute of Advanced Architecture of Catalonia). The project develops a workflow between GIS & Grasshopper using open source data of Bogotá (IDECA) and a multipurpose survey done by Secretaría Distrital de Planeación (SDP) & DANE in 2017. We hope this project demonstrates the opportunity to create data-driven urban design decision-making that benefits marginal communities in urban centers. This research exploration focuses on, Bogotá – Colombia.
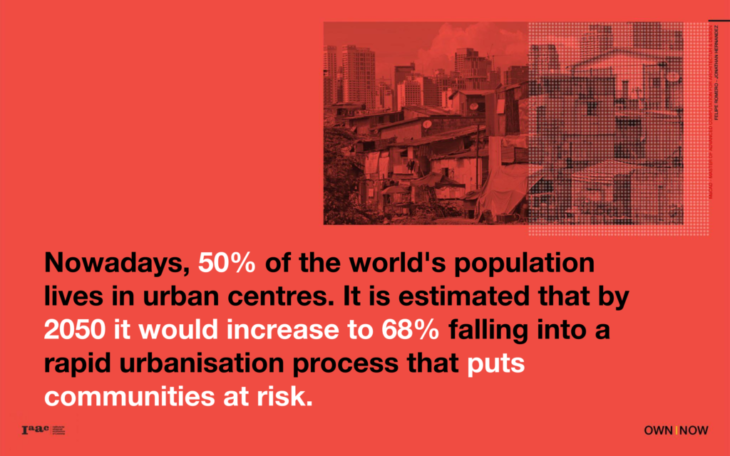
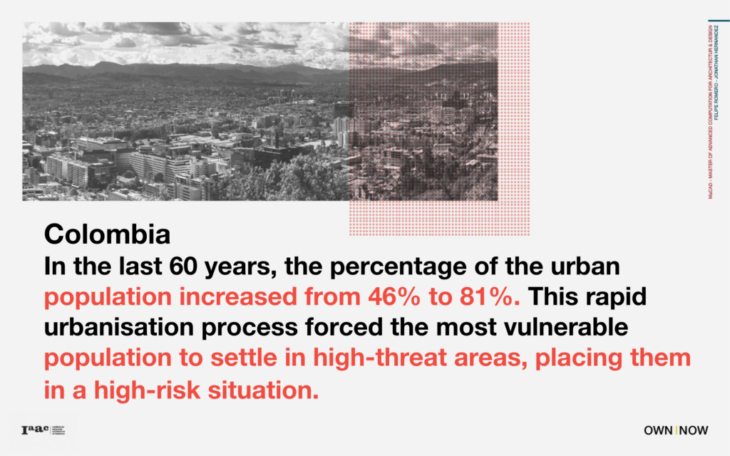
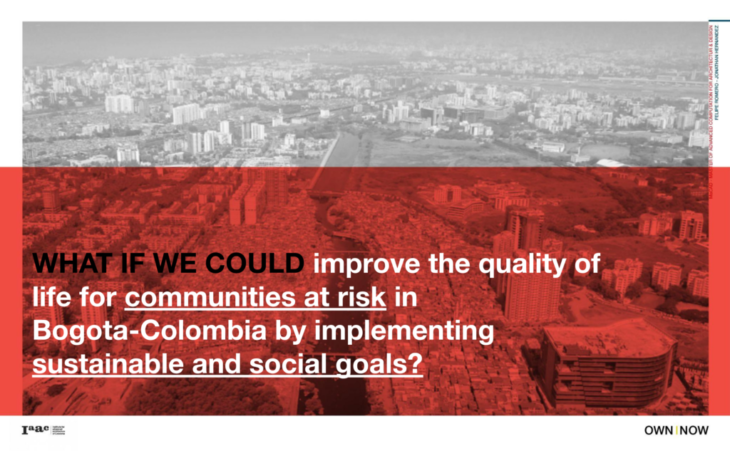
In the last 60 years, the percentage of the urban population increased from 46% to 81%; in Bogotá, it is estimated that the population will increase by over 13 million in 2050 (UN, 2018). One of the significant issues of the rapid urbanization problem is the development of informal settlements in unplanned urban areas. Unplanned areas of the city are characterized by the lack of access to public, social and urban infrastructure. This rapid urbanization process forced the most vulnerable population to settle in high-threat areas, placing them in a high-risk situation. Furthermore, two major natural bodies are bounding the city of Bogotá, “Los Cerros de Bogotá, a chain of hills that goes along the city on the eastern side, and Bogotá River on the western side of the city. These two significant natural bodies are associated with flooding and bushfires hazards that affect informal settlements located on the city’s periphery. Studies show that the city has developed an urban plan (Plan Maestro de Bogotá) that proposes an urban strategy to adapt to the city’s future development, focusing on adapting the different investment levels and land use requirements to develop urban and social infrastructure. However, there is a need for more detailed studies of potential risks the city faces and to understand how to improve quality of life and mitigate environmental, social, economic, and cultural threats for marginal communities
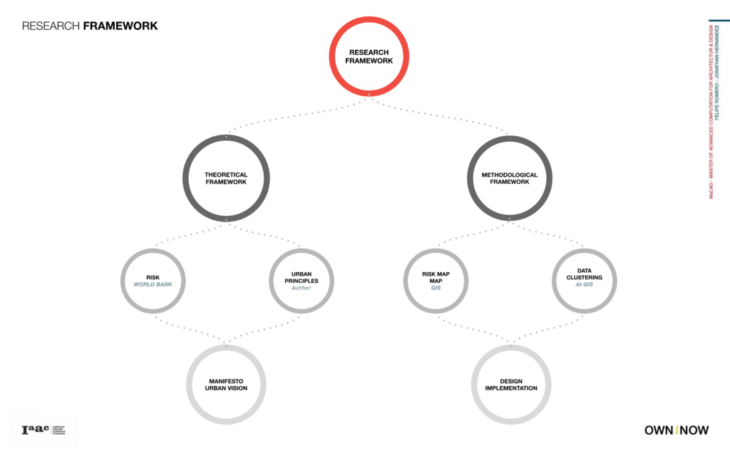
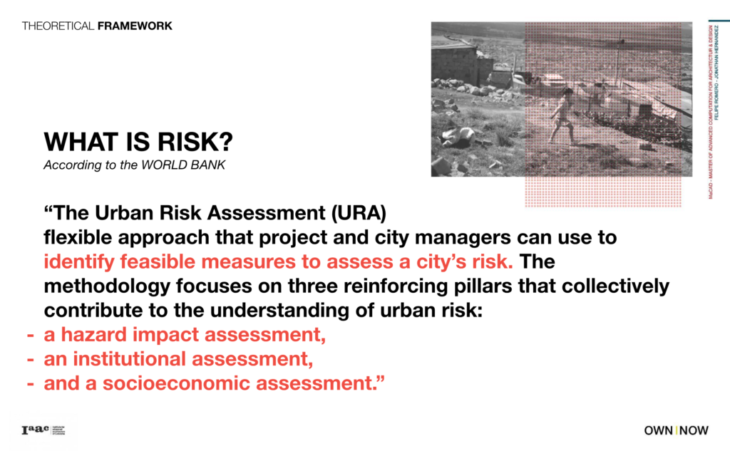
This research aims to combine a Theoretical and a methodological framework with the purpose to define at the end of the study an Urban manifesto and a design implementation (developing a workflow between ArcGIS and Grasshopper) What is Risk? The Urban Risk Assessment (URA) presents a flexible approach that project and city managers can use to identify feasible measures to assess a city’s risk. The methodology focuses on three reinforcing pillars that collectively contribute to the understanding of urban risk: a hazard impact assessment, an institutional assessment, and a socioeconomic assessment. (World Bank, 2021) Risks can be described as an interaction between exposure to natural hazards, including the adverse effects of climate changes and the vulnerability of societies (World index, 2014). It is the function between the hazard (Probability of occurrence of potentially damaging food events), the level of exposure of the societies (Exposure Receptors that may be affected: People, properties, infrastructure, environment), and the level of vulnerability (Social, economic, environmental characteristic of a system that describes its potential to be harmed. (Mc Gahey 2009)
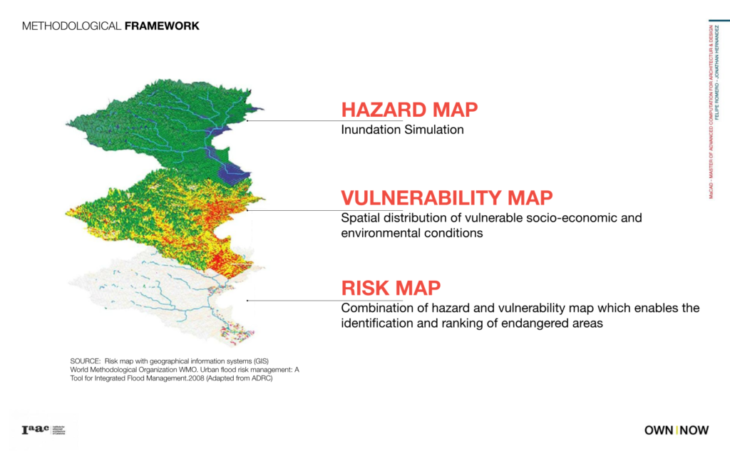
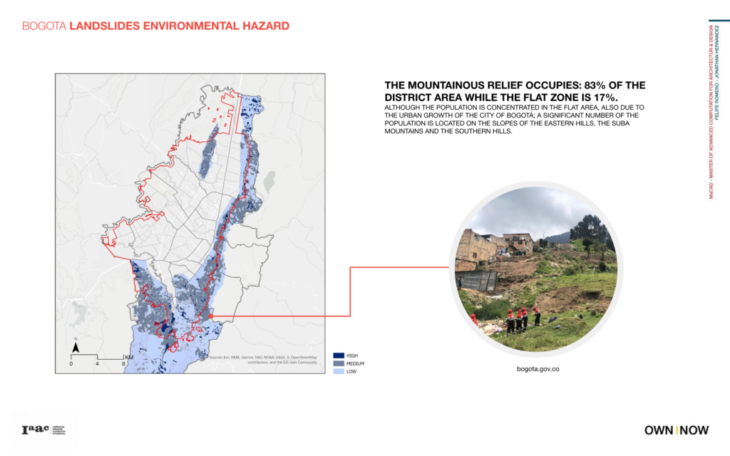
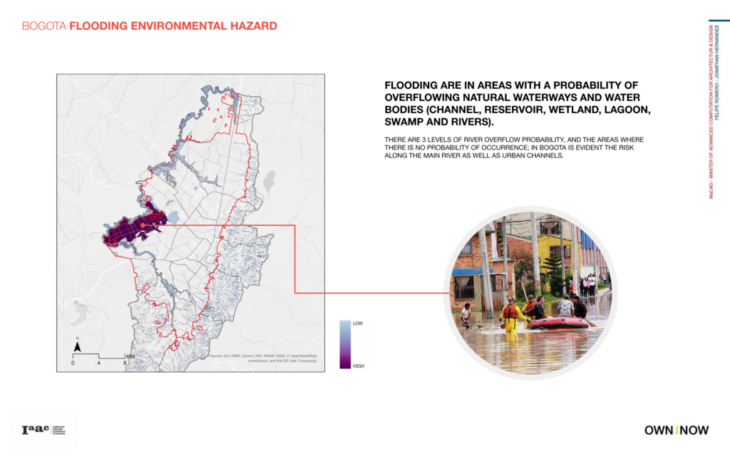
In this sense, risk maps are an essential tool to communicate hazards and associated risk levels. They are necessary for decision-making because they are visual tools that help determine areas without defense structures. They are crucial for planning development activities, emergency planning, and policy development. Risk maps combine hazard maps with a vulnerability map that relates the spatial distribution of vulnerable socioeconomic and environmental conditions, determining the potential adverse effects of a hazard event. (WMO, 2021) For instance, flooding is one of the natural phenomena that represent a risk for the urban environment and it should be considered within the city’s water management strategy. It is a natural phenomenon that cannot be prevented and can produce fatality events, displacements, and several impacts to the environment (natural and urban), which directly affect society and its economic development. Flood risk can be described as an interaction between exposure to natural hazards including the adverse effects of climate changes and the vulnerability of societies (World index, 2014). It is the function between the hazard (Probability of occurrence of potentially damaging food events), the level of exposure of the societies (Exposure Receptors that may be affected: People, properties, infrastructure, environment), and the level of vulnerability (Social, economic, environmental characteristic of a system that describes its potential to be harmed. (Mc Gahey 2009) In the same way, Bushfire hazards are usually computed or expressed as to potential fire behavior (e.g. fire-line intensity) or fuel physical and chemical properties (UNISDR, 2017). Landslide hazards are related to the downward movement of slope-forming materials, such as rock, soil, artificial fall, or a combination of them. This phenomenon can happen when the materials may move by falling, toppling, sliding, spreading, or flowing (UNISDR, 2017 )
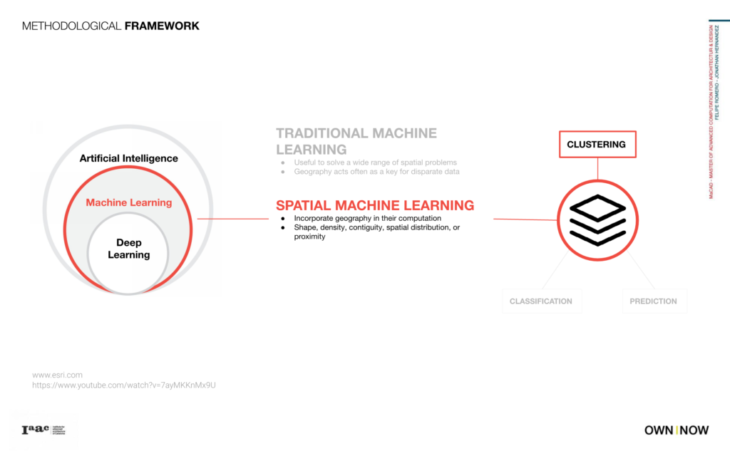
ArcGis was chosen as the primary tool to analyze the city of Bogotá to manipulate and develop an urban spatial analysis related to geographical information. ArcGIS Pro offers the possibility to use machine learning classification methods to classify remote-sensing imagery. Likewise, the software uses deep learning relying on multiple layers of nonlinear processing for feature identification and pattern recognition (ArcGIS 2021)
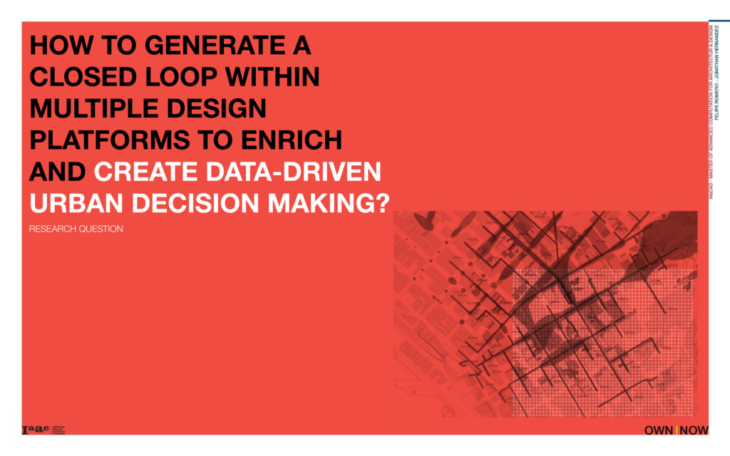
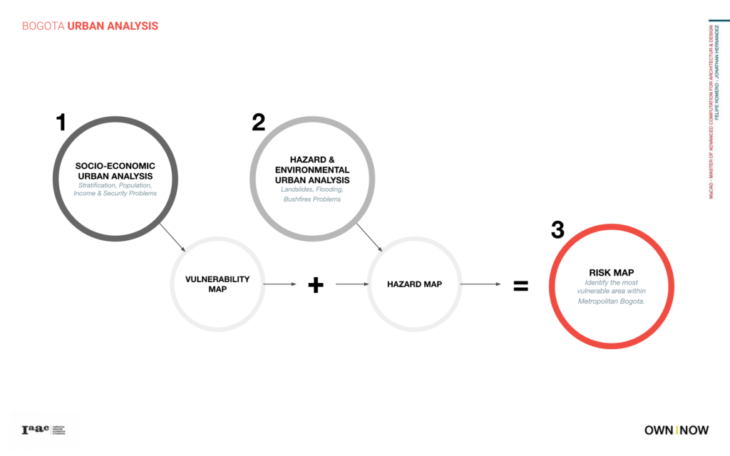
The presented research is situated in the computational design field applied to large-scale urban systems, focusing on socio-economic and environmental urban data in Bogotá, Colombia. This research aims to implement a data-driven approach to urban policy decision-making by underpinning vulnerable areas of the city using Bogotá’s urban data. This includes analyzing the entire city by combining a Hazard Map that incorporates environmental data, and a Vulnerability Map that integrates socio-economic data. The result of this process is highlighted in a Risk Map that depicts the city’s most vulnerable areas by incorporating multiple layers of information. Some specific methodological objectives include:
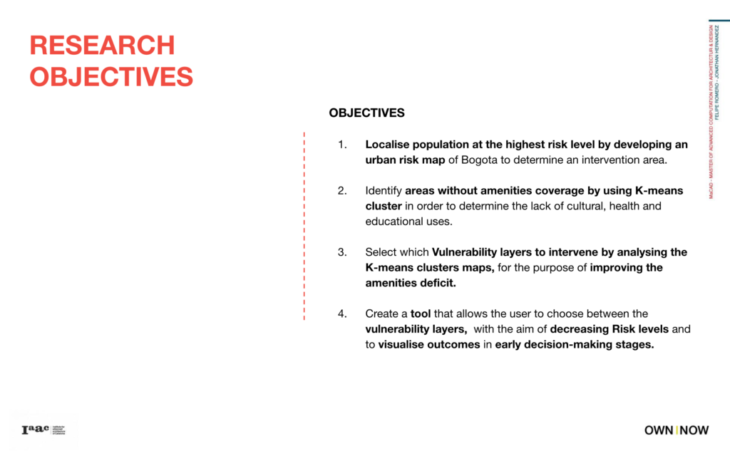
As a result of the analysis process, this research explores a new workflow between ArcGIS and Grasshopper (visual scripting tool), intending to manipulate the urban data and introduce new urban assumptions to improve the risk problem within the city. Some specific objectives for the proposed stage include:
- Develop a computational design strategy that enables new compatibility between ArcGIS and Grasshopper.
- Explore within the Grasshopper environment the extraction and manipulation of urban data to create a new intervention as a result of the urban analysis.
- Develop a user interface using (HumanUI – Grasshopper plug-in) that enables user interaction and introduces new urban data to visualize in real-time the impact of these decisions within Bogotá.
- Introduce a comparative approach between the result from ArcGIS and the intervention in Grasshopper, enabling urban designers and urban planners the opportunity to analyze the impact of decision-making
in the early stages. - Define the character of future projects by targeting different land uses and risk types in specific areas of the city that benefit marginal communities. Open the opportunity to create a web server
application such as RhinoCompute to improve the user experience.
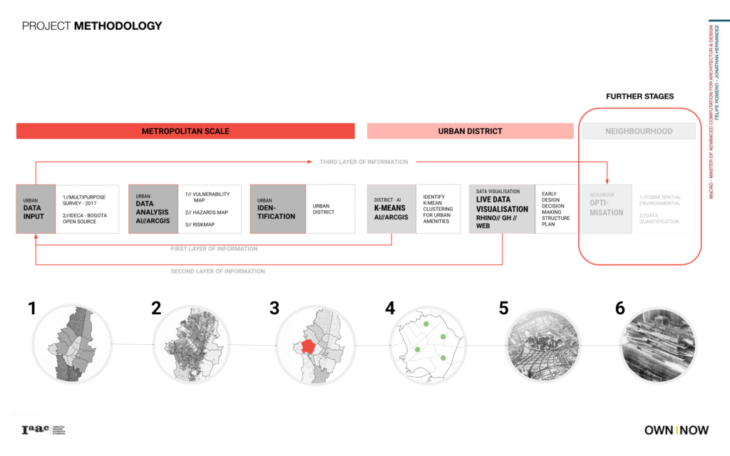
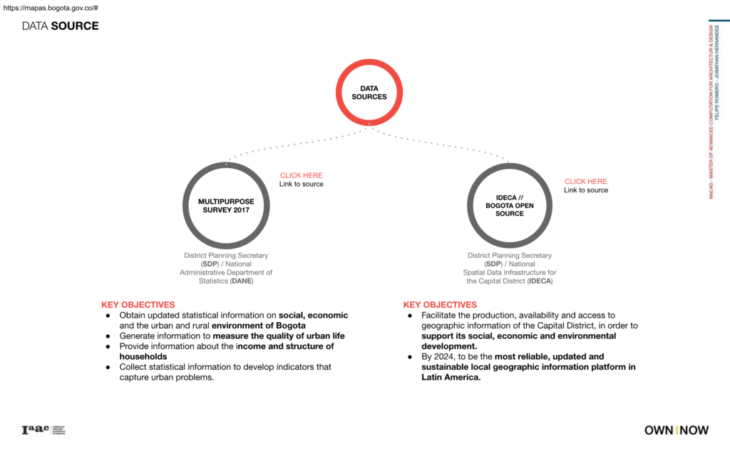
The project methodology is proposed in 3 different scales: metropolitan, urban district, and neighborhood scale. The project was developed for the metropolitan and urban district scales, but this research opens the opportunity to explore in further stages a neighborhood scale, that throughout computational design approaches such as optimization and environmental performance, can target specifc projects. A GIS-based spatial multi-criteria analysis was developed on the metropolitan scale to produce the Risk Index Map that combines hazard probability and existing vulnerability information to intervene in the urban district with the highest risk levels. Moreover, for this research, two data sources were selected. Firstly, the Multipurpose Survey (2017) was developed by the District Planning Secretary (SDP) / National Administrative Department of Statistics (DANE). In this survey, some of the key objectives for this data set include:
- Obtain updated statistical information related to social & economic features for Bogotá’s urban and rural areas.
- Generate information to measure the quality of urban life across the city.
- Provide information about the income and structure of households for Bogotá.
- Collect statistical information to develop indicators that capture multiple urban problems
Secondly, this research combines open-source data collected from IDECA (Infrastructura de Datos Espaciales para el Distrito Capital) website. Some of the main objectives from this organization include:
- Facilitate the production, availability, and access to geographic information of the Capital District in order to support its social, economic, and environmental development.
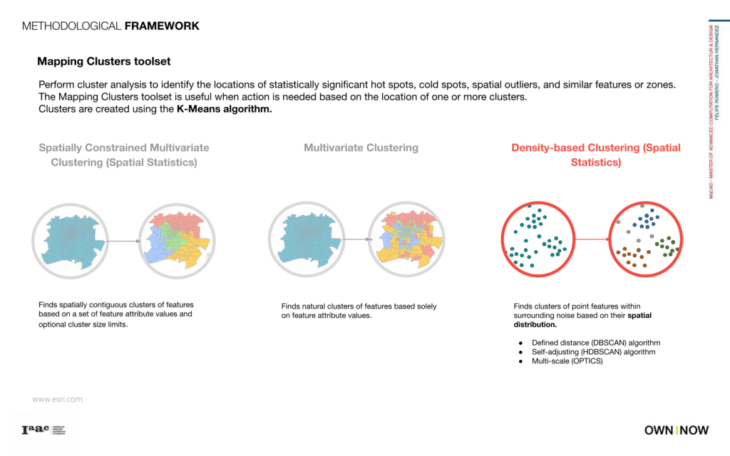
- By 2024, become the most reliable, updated, and sustainable local geographic information platform in Latin America. In the urban district scale, the chosen district is analyzed using K-means clusters to determine the lack of cultural, health, and educational uses and identify areas without amenities coverage.
In this way, a script is proposed to introduce new values that help risk mitigation and highlight areas that can improve cultural, social, and educational values. As a consequence of the analytical process, this research introduces a new workflow between ArcGIS and Grasshopper (visual scripting tool). The intention is to manage the result from ArcGIS and explore a new workflow to introduce and visualize new urban data as a potential solution to the risk issue in the city. The final product is presented using Human UI (plug-in for Grasshopper) to develop a user interface that can help to visualize results in real-time. This interface’s key objective is to allow urban designers and planners to analyze multiple solutions that target a specific urban issue. Moreover, this real-time visualization enables the opportunity to have a data-driven approach to early decision stages, primarily when defining urban policies and urban design decisions.
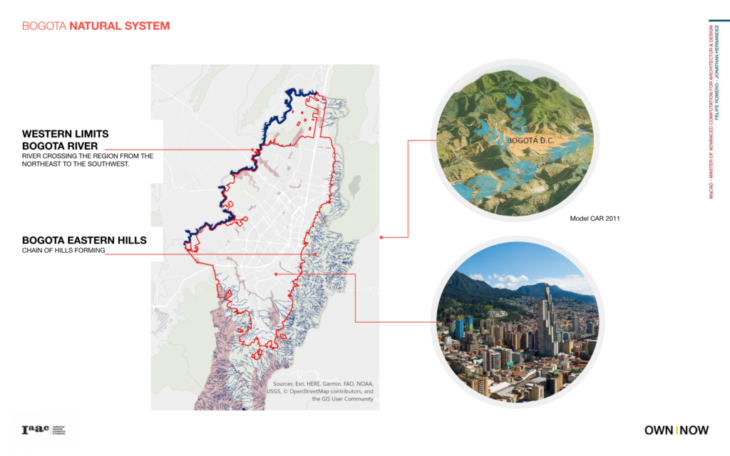
The city is located on the ‘Cundiboyacense’ plane and is bounded in the east by a mountain range highlighting the ‘Monserrate’ and ‘Guadalupe’ hills. In the west, it is bounded by its longest river, the Bogotá River. Bogotá has a temperate climate, frequent rainfalls, and temperature variations throughout the year. Moreover, the temperatures regularly range between 6 to 24 ° C with an annual average of 15 ° C. The annual Precipitation varies between 800 to 1000 mm/yr for mainly rainy reasons: April – May, October – November ( Alcaldia de Bogotá, 2021). The eastern hills and the Bogotá River, together with the rural soils, form an environmental and protected belt around the city, whose primary purpose is to contribute to the ecological balance of the city and the region, avoiding conurbation processes with the neighboring municipalities (Alcaldia de Bogotá, 2021). Bogotá is limited on the east by the Andes Mountain, the forest reserve, the protection area, and many rivers’ sources (See Figure 10). Figure 10 shows the Bogotá River, which runs through the Capital District along the western side of the urban area (380 km) and is formed by multiple streams and drainage channels from the eastern hills (Secretaría distrital de Ambiente, 2021). The river is divided into three basins: High, Medium, and Low. The Medium Basin corresponds to the urban area and is divided by the following sub-basins: The rivers Torca, Salitre, Fucha, and Tunjuelo. A network of green spaces constitutes the primary ecological structure, which seeks to guarantee sustainability and habitability in the city. The most prominent example is a natural reserve, called the Sumapaz, which is more extensive than the city itself, located the largest moor in the world at 3,900 meters above sea level (See Figure 9).

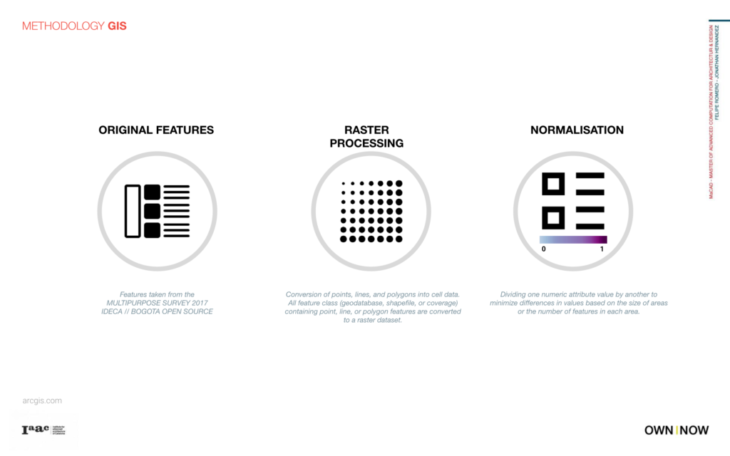
There are several methods to analyze, assess and evaluate the food risk. On the one hand, some strategies focus on the qualitative characteristics, and on the other hand, some methods consider the quantitative features or alternatives. One of the most common is the Multi-Criteria Decision Analysis (MCDA) which establishes preferences between options (choices) by referencing an explicit set of objectives. Typically, decision-makers use it, involving selecting tangible and intangible criteria with different units, scores, and weights (Mc Gahey 2009). However, it can be argued that decision-makers usually rely on the information without knowing the spatial relationship to it. The great advantage of the MCDA is that it provides a variety of techniques and procedures to structure decision problems. Primarily to design, evaluate, and prioritize alternative decisions. It is a process that transforms and combines geographical data and evaluates judgments to obtain information for decision making. The spatial decision problems typically involve many feasible alternatives and multiple, conflicting, and unequal evaluation criteria. Moreover, several actors often evaluate the other options: decision-makers, managers, stakeholders, or interest groups (Murayama 2011). The risk analysis component combines the hazard probability with the vulnerability of the population that is exposed. In this sense, a food risk index map is developed to identify the areas in Bogotá where vulnerable urban settlements overlay activities, infrastructure, and environment exposed to the flood hazard. In order to have an equivalence and compatibility, a standardized process needs to be implemented throughout the urban analysis. Although it is a simple method that does not give the equivalence between the different indicators, it helps to relate the information in an approximate equivalence. For example, a set of equations can be used for standardization value maps to convert absolute map values to a range between 0 and 1. The closer these numbers are to 1, the higher the probability or vulnerability is, and the closer these numbers are to 0, the lower their implication is.
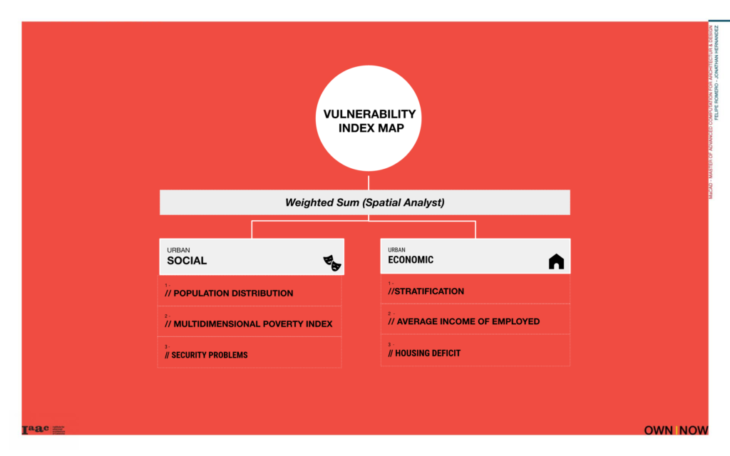
The Vulnerability Index is another crucial determinant in food risk because it determines whether or not the population or assets are exposed to a hazard that can constitute a risk that may result in a disaster. For this research, the Vulnerability Index uses a group distribution that includes social and economic urban data. Thus, it relates to population distribution, multidimensional poverty index & security problems. In addition, it also analyses stratifcation, average income, and housing defcit as the main economic factor which makes people or systems susceptible to the impacts. Vulnerability considers concepts and the situation of a settlement in terms of its susceptibility, lack of coping capacities, and adaptability. In general, it evaluates the abilities and capabilities of receptors to manage with and adapt to adverse impacts of natural hazards (WorldRiskReport 2015). For the case of the vulnerability index map, a Spatial multi-criteria analysis was developed.
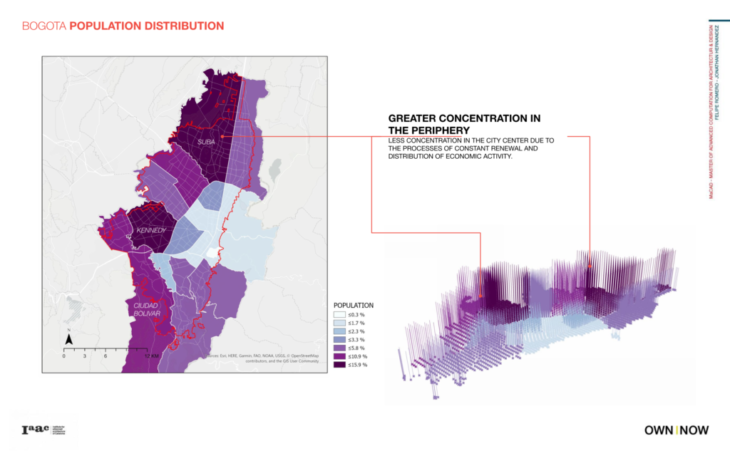
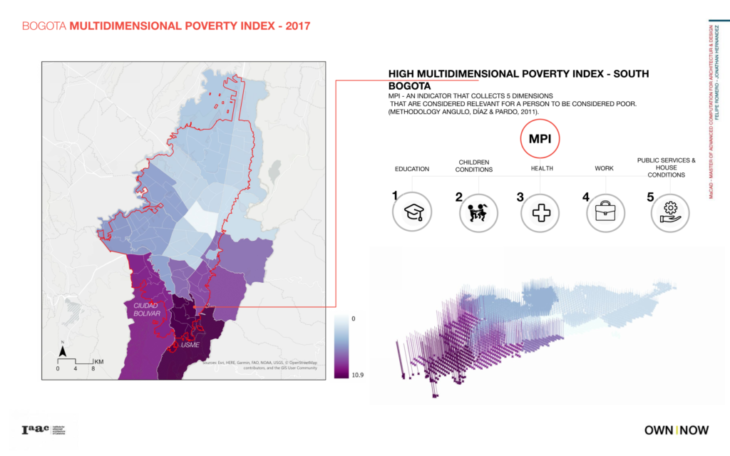
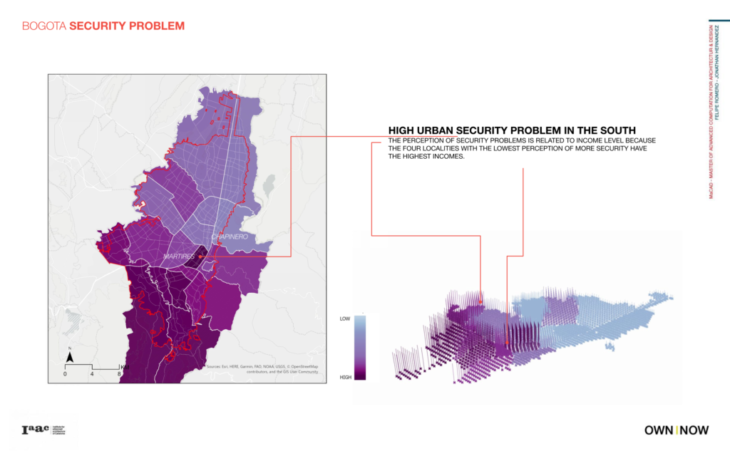
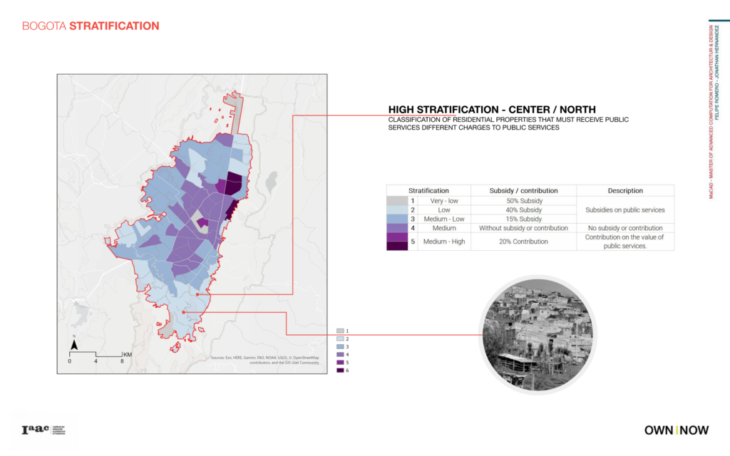
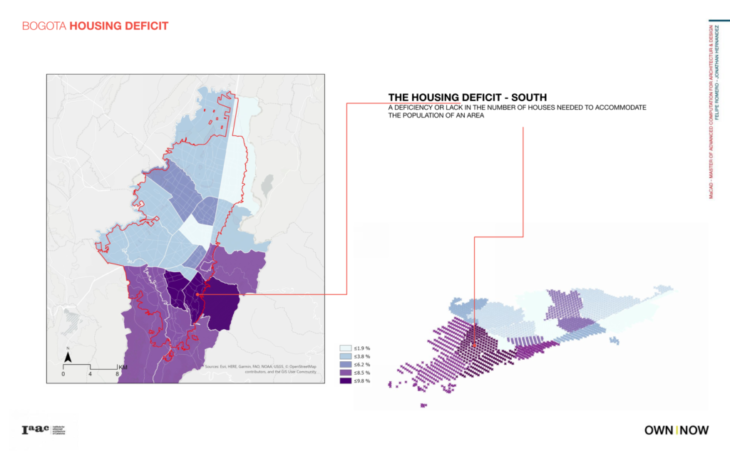
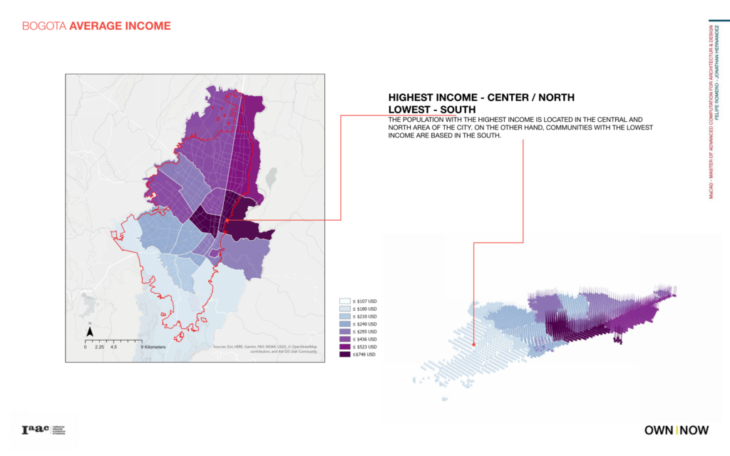
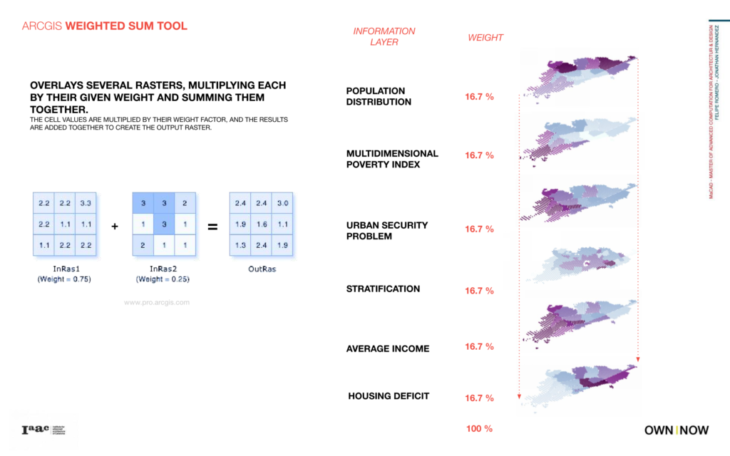
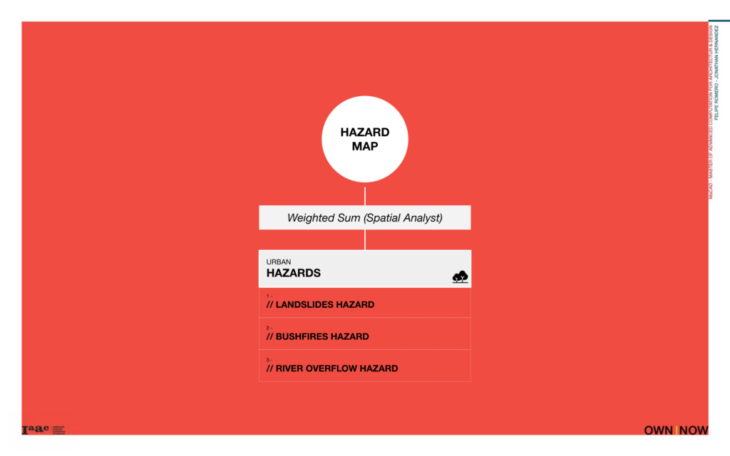
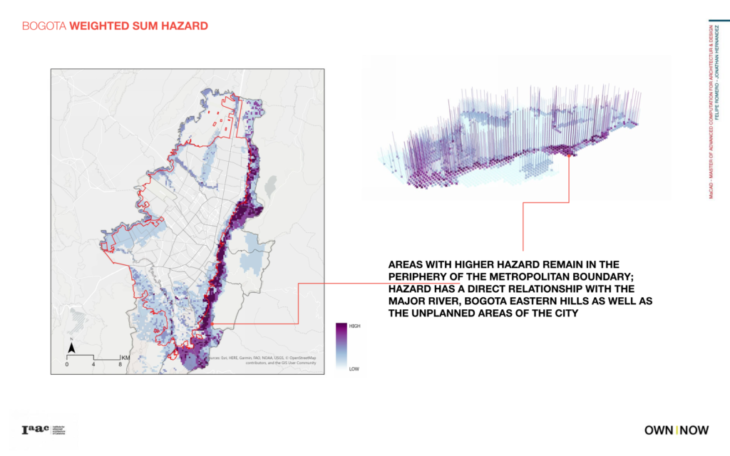
In order to obtain the vulnerability index map and combine the selected criteria, the ArcGIS tool weighted sum was used. According to the program developers, the `Weighted Sum´ tool can weigh and combine multiple inputs to create an integrated analysis. It is similar to the `Weighted Overlay´ because it multiples raster inputs, representing multiple factors, and can be easily combined incorporating weights or relative importance. The Weighted Sum tool is helpful in maintaining the model resolution or when floating-point output or decimal weights are required. Additionally, the Weighted Sum works by multiplying the designated field values for each input raster according to the specified consequence. It then sums (adds) all input raster together to create an output raster. (ArcGIS 2021)
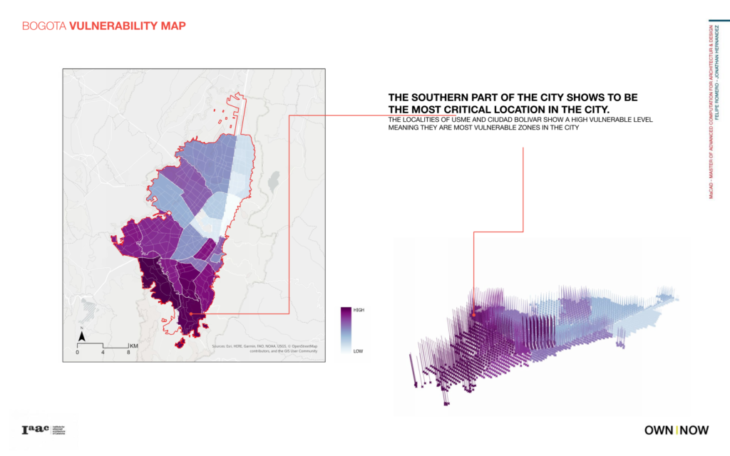
The six selected raster layers (Population distribution, Multidimensional poverty, Urban security, Stratification, Average income, and housing deficit) were overlayed, multiplied by their given weight (16.7%), and then summed up. As a result of the weighting and standardization, the final vulnerability index map is shown in Figure 27. The values range between 0 – 1, and it helps to identify the most vulnerable areas in the city. The south part of the city again shows to be the most critical location in the city. It is worth mentioning again that this results from combining different economic, social, and physical aspects, showing dire conditions.

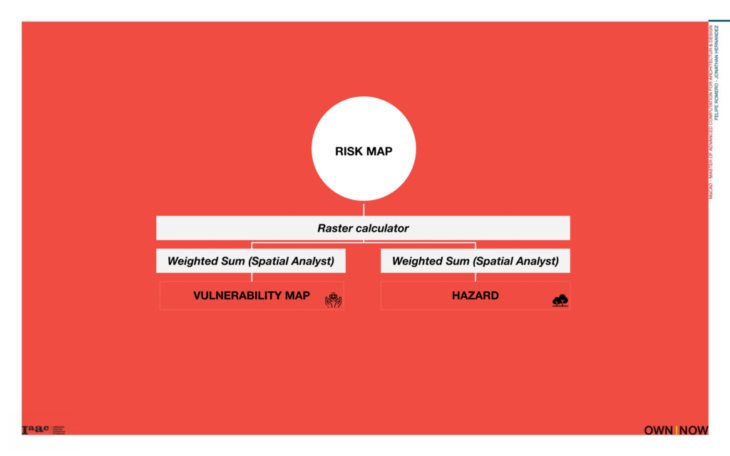
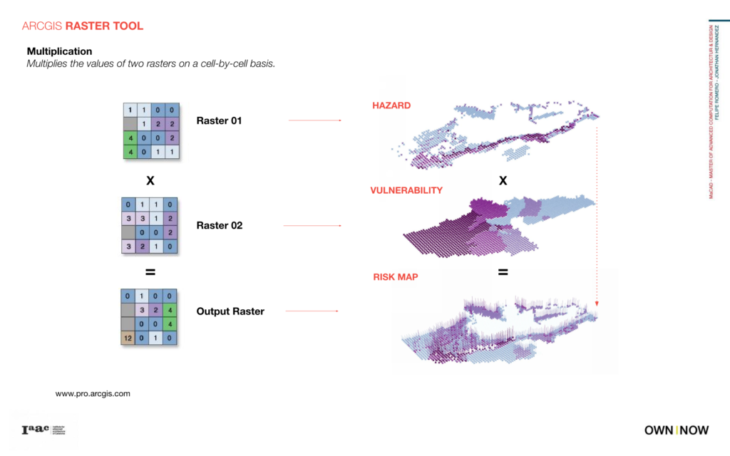
The final step for the risk index map is the combination of the hazard and the vulnerability. In this regard, the ArcGIS tool of the raster calculator was used. This tool is designed to execute a single-line algebraic expression using multiple tools and operators. When multiple operators are used in one expression, the performance of this equation will generally be faster than executing each of the operators or tools individually. For this case, the multiplication operation was used simply by multiplying the values of the two rasters on a cell-by-cell basis. (ArcGIS 2021) Figure 36 shows the final food risk index and clarifies the risk locations in the city. It was also re-classified in a range between 0 and 1, indicating that the darkest color approaches one as the highest risk level and the lightest colour to 0, showing the lowest risk level. The map gives a general overview of the current situation and already locates the high-risk zones. The risk index map shows that the city’s center has a low-risk level and the city’s south has a high-risk level. The area located in USME was selected as the main area to be intervened, considering that this area has the highest vulnerability in the city.
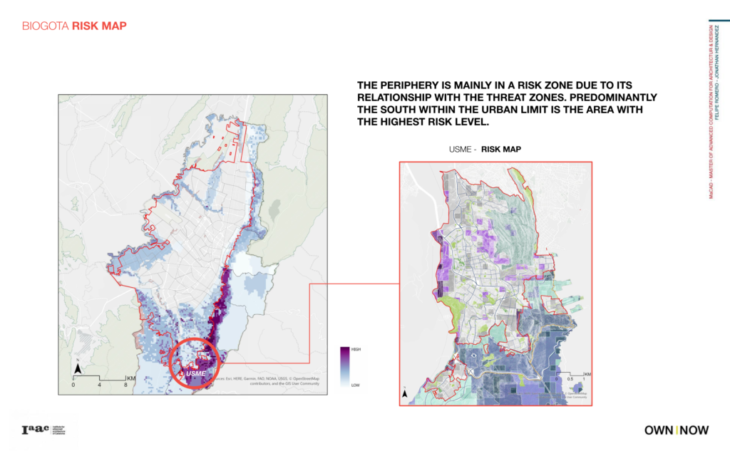
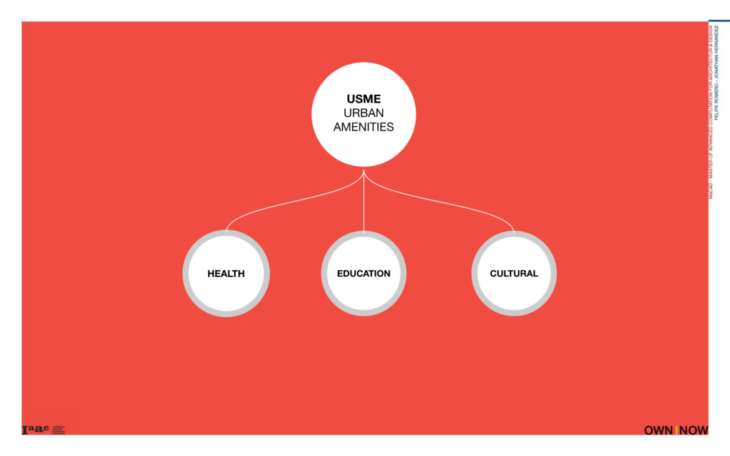
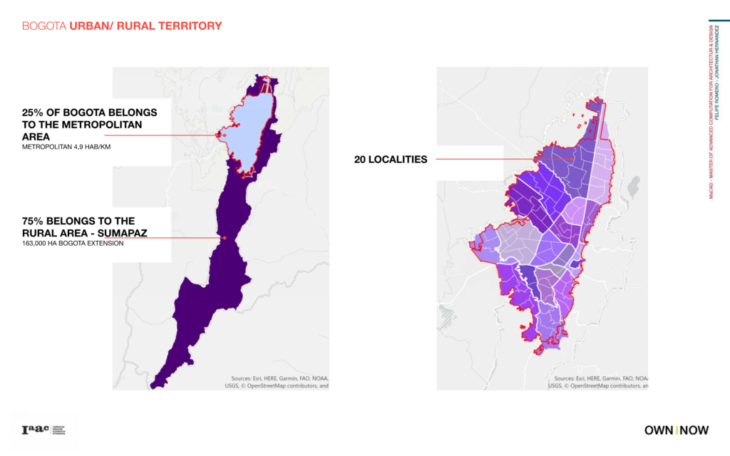
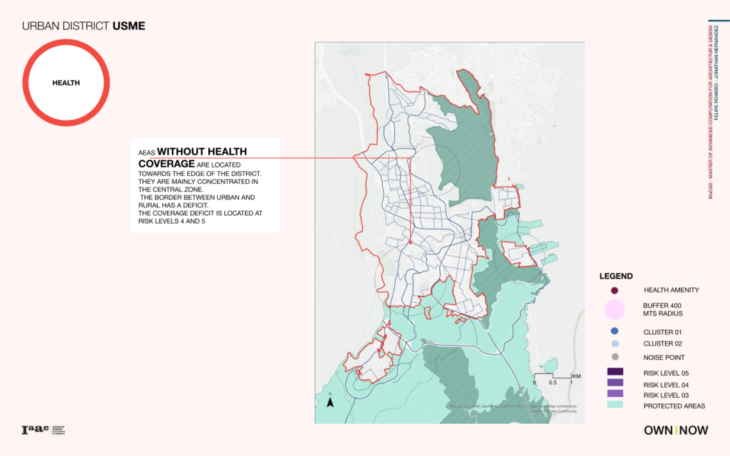
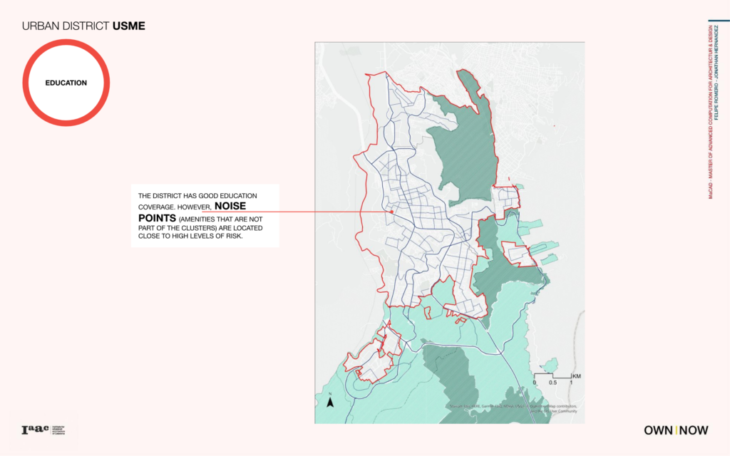
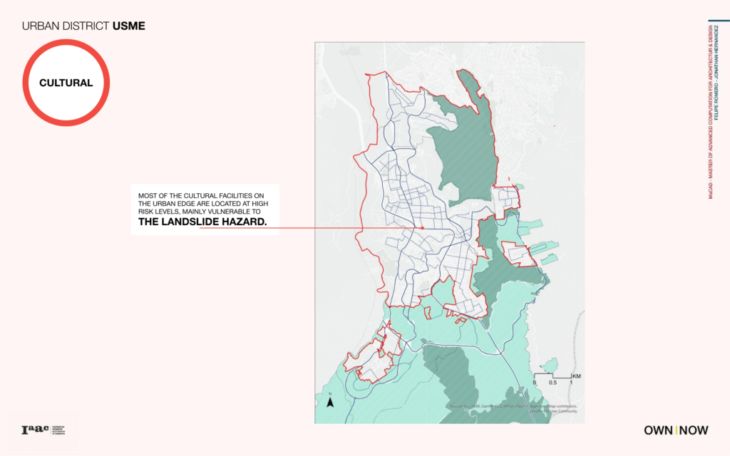
Usme limits to the north with the districts of San Cristóbal, Rafael Uribe, and Tunjuelito. It is limited to the south with Sumapaz, to the east with the municipalities of Ubaque and Chipaque. To the west, it is limited with the district of Ciudad Bolívar and the municipality of Pasca. It has approximately 300,000 inhabitants. It is divided into 7 UPZ (Zonal Planning Units). The district has 21,506 hectares of these, 2,120 correspond to urban land, 902 ha are classifed as urban expansion land, and the remaining 18,483 ha constitute rural land. Figure 37 shows the results obtained in the Urban Risk map for the USME district. The risk levels were re-classifed in 5 levels, one the lowest and fve the highest risk levels. This map helps to identify possible intervention zones where there is a critical situation. On the other hand, by using K-means clusters, the aim for the Usme district was to determine the lack of cultural, health, and educational uses and identify areas without amenities coverage.

“The ‘solution’ in urban design is expressed as a product of urban design: a rule, plan, or pilot project that sparks and guides urban transformation. The process of designing the solution is done in constant collaboration with the community and under constant pressure from the forces of politics and finance, but the scope is far narrower than designing the question” (Washburn,2013)
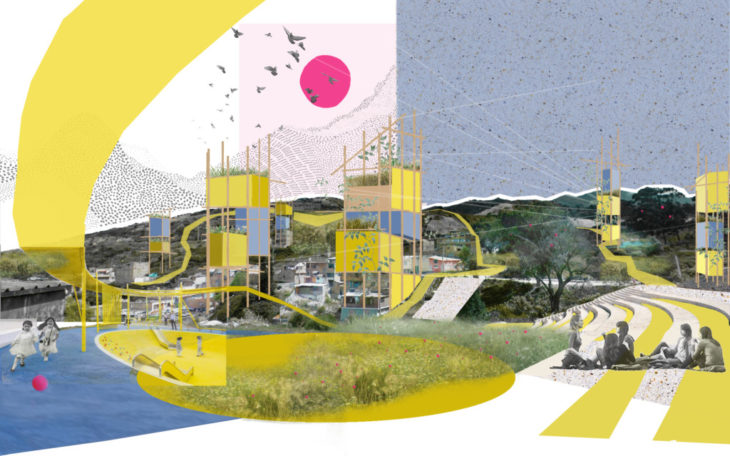
How to improve the future of marginal communities at risk? Furthermore, how-to guide a better future that engages the community and enhances cultural and social values? The urban design vision developed under these two questions fall into three different levels:
- Embrace ( a vision)
- Deep Design Thinking ( a principle)
- Implementing (an action)
A series of principles have been developed under these levels that aim to tackle the urban analysis issues. In addition, this hierarchical categorization aims to define a series of actions that take into account:
- Community: A vision to promote a participative, inclusive and diverse community; this vision can be implemented through open spaces, community rooms that would help to improve vulnerable areas.
- Environment: enhancing a reconnection with nature by introducing urban agriculture, implementing ecological materials, and promoting a circular economy; this can be done by creating community gardens and promoting sustainability values.
- Culture: creating new cultural spaces that share experiences, open new education networks, and promote performance and art events. Identity: adapting and improving the existing by introducing uniqueness and promoting a sense of belonging, social cohesion, and supporting local programs.
- Adaptable: introducing a modular system to future projects promotes vernacular principles, maximizes affordability, and creates resilience.
- Integrative: promoting flexible urban amenities that share a vision, promote social integration, and create regenerative processes.

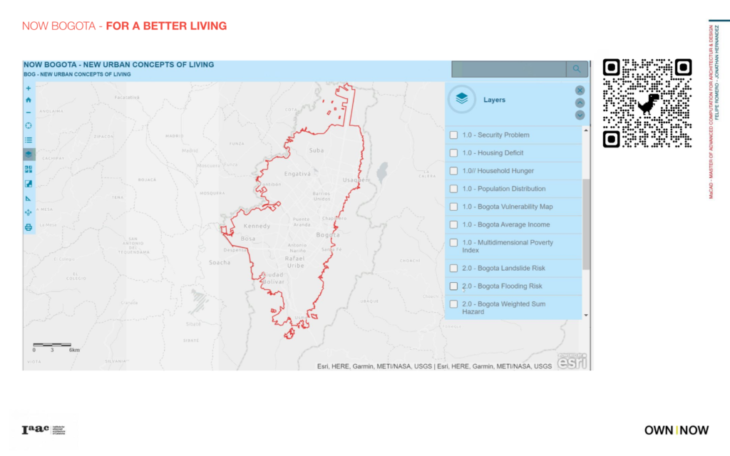
In order to make accessible all the studies created, the layers of information were uploaded to a website using ArcGIS Online. Figure 48 shows the interactive interface that can easily be manipulated; it can be accessed via the link below and scan the QR code. On the left side, the user could zoom in and out and change the BaseMap. For example, the user could change between a satellite map, street map, or Hybrid. The measuring tool is also available, which allows the user to create areas, have measurement results, and find out the coordinates from a place. On the right side, the user can manipulate all the layers created in the study. The first layers are related to the city’s main features like the city boundaries, the expansion areas, and the Urban districts. Later, the user can manipulate the layers used to create the Vulnerability map, Hazard map, and Risk Map results. Furthermore, the existing cultural, health, and educational facilities and the results Clusters created with the K-means cluster tool are available. Using these maps is important because all the results from the analysis could be compared with authentic and accurate images to Identify and Mitigate Risk for the entire city.
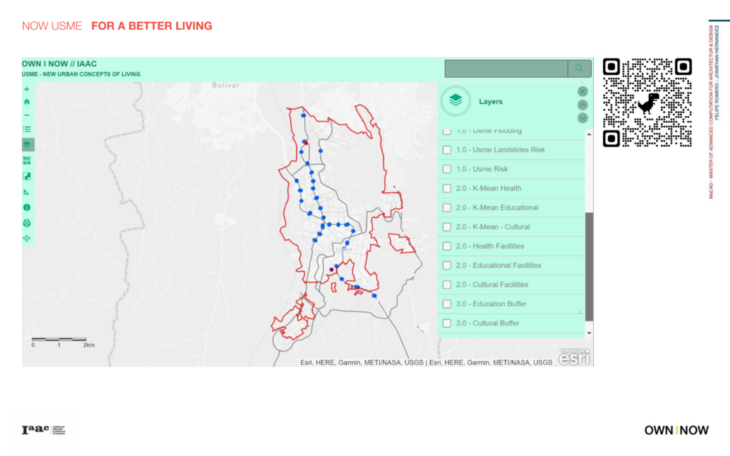
In the case of Usme, the selected district is part of the urban analysis. The layers structure follows as well the same logic as for the city of Bogotá. The user can manipulate the urban district scale, public transportation, primary and secondary roads, and the green area network. These urban layers could be combined with the layers used to create the Vulnerability map, Hazard map, and Risk Map results. In addition, the K-means analysis has been included to understand the proximity of these urban amenities with the risk areas. The urban district scale can visualize the information with topographical satellite maps and reveals exact points for intervention. The information for specific points can be displayed by clicking on these elements; this allows the user to access the meta-data embedded as part of this research.
The computational design strategy of this project aims to encourage integration between urban design & planning with the architectural workflows. Therefore, it uses the power machine learning (ML) using K-means clustering in ArcGis with visual Scripting in Grasshopper. ArcGis was used in order to obtain the vulnerability index map and the Hazard index Map that combine selected criteria, it was used the weighted sum tool. For the food risk index Maps, combining Vulnerability and Hazards, it was used the raster calculator tool. The integration between ArcGis and Rhino+Grasshopper was possible using the Plugin Urbano. This tool allows the user to load urban data from OSM as well as to manipulate meta-data from Shape files (SHP) into Rhino. Also, it enables building contextual models that can be used for simple visualization and site analysis to complex mobility simulations using the loaded street grids (Urbano, 2020) Once the ArcGIS maps were brought into the Rhino interface, the next steps were to extract the meta-data that was part of the shapefle (for this case, the risk values). The meta-data was extracted in order to create a cloud of points where the different risk levels could be visualized with colors. The purpose of bringing the maps into grasshopper was to flter the information and select only the highest risk levels within the city to intervene. Finally, some assumptions were developed within the interface to forecast future jobs, No. of future dwellings and jobs. The overall idea was to introduce new projects with these assumptions in order to visualize what the future risk map would look like; projects can target specific risks and introduce new mitigation strategies.
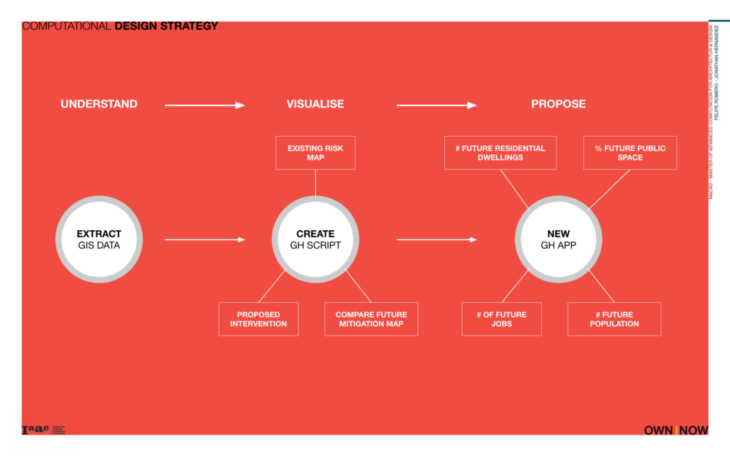
The overall grasshopper script developed into seven main parts, starting from the extraction of the GIS file to the creation of a user interface.
- First Part: The first part uses Urbano in order to extract the key values (meta-data) from the methodology developed in GIS. The overall idea was to generate a filter for the meta-curves with the different risk levels.
- Second Part: For the second part, the data tree was hierarchically organized by risk levels; this allows selecting the highest risk levels and visualizes the areas to intervene.
- Third Part: This step takes the highest levels and brings them as separate items to perform a mathematical operation that introduces new values based on multiple assumptions. These assumptions include the future number of jobs by the future population, the number of future residential dwellings, and commercial areas
- Fourth Part: Organises the data tree and the geometry for the lowest risk values, which are values 1 to 2. Considering the lowest risk associated with these values, they were combined with the result of step 3.
- Fifth Part: This step combines the geometry identified in GIS with the values resulting from the mathematical operation (step 3); the new values are embedded into the geometry by using the Urbano plug-in. This step reduces the risk levels based on the user’s definition of the assumptions( that for the purpose of this research are focused on educational, residential, and cultural).
- Sixth and Seventh Part: These two steps generates a spider diagram that changes based on the input values and creates a user interface using Human UI (plug-in for Grasshopper developed by nbbj) It can be argued that Grasshopper has the power to enhance architectural workflows rather than urban data; however, this research intends to give an idea of how a new workflow can be implemented between these two platforms.
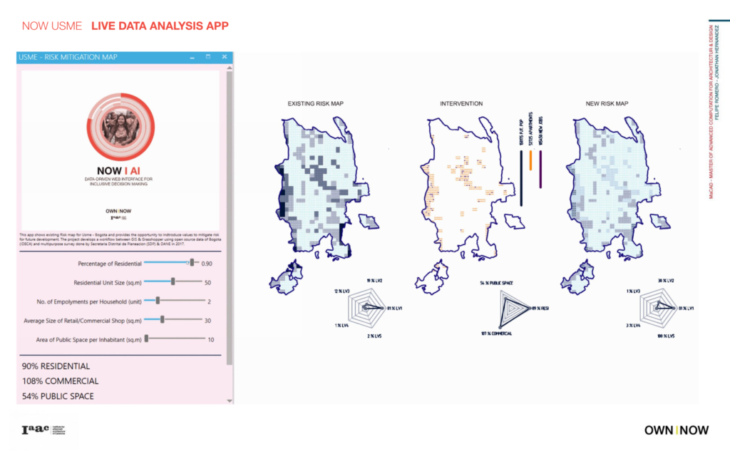
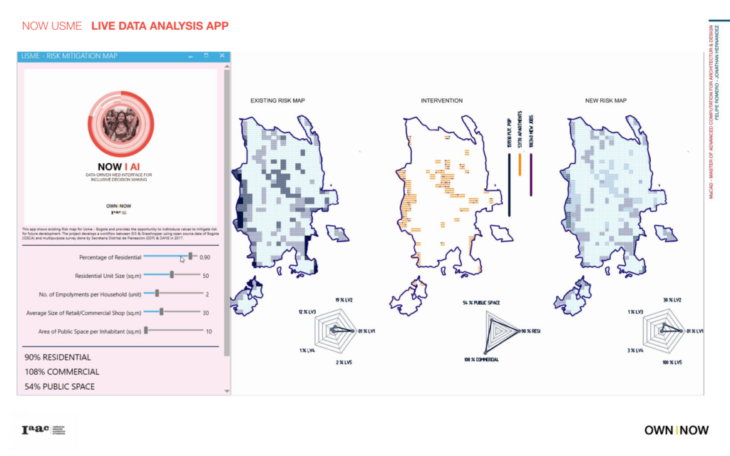
Human UI is an open-source project developed at NBBJ by the Design Computation Leadership Team (2016). Human UI enables the opportunity to generate a user-friendly interface without needing to write any code. For this research, the user interface was developed to control the inputs for the urban design assumptions to visualize a proposed risk map. The overall idea seeks to enable three different live maps that enable a comparative process. Firstly the app shows the map resulting from ArcGIS in Rhino. Secondly, the app shows an intervention map displaying different land uses (commercial, residential, and public space). Thirdly, a new risk map appears as a result of the input values by the user; some of the input values that adjust the proposed mitigation map includes:
- Percentage of residential use
- The Average unit size (sq.m) for residential uses
- Number of employments per household (unit)
- The average size of retail/commercial space (sq.m) – this value provides a ratio to commercial/retail jobs
- Area of desired public space for the future population (per inhabitant) Finally, at the bottom of the interface, the user can visualize the percentages calculated based on different inputs and open the ArcGIS Online website (within Rhino) for Bogotá and Usme to validate data.
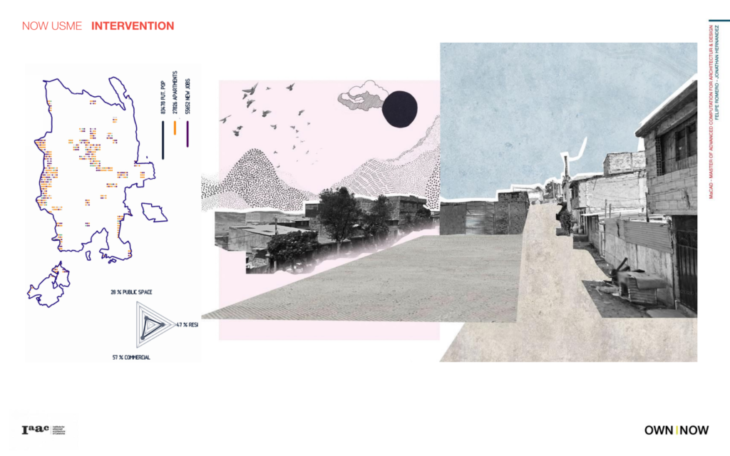
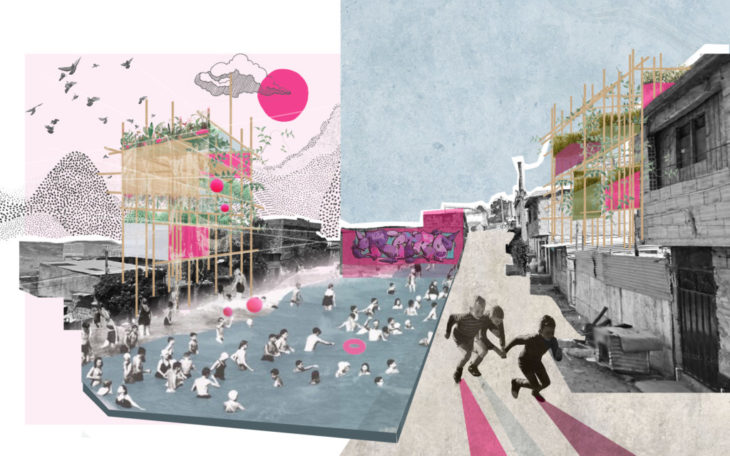
These benefits relate to the social, environmental, and economic aspects. When the strategy is implemented, for example, in social terms, the quality of life of the inhabitant’s increases. The simplest example is the development of new public spaces and the improvement of the existing ones, and providing recreational areas transforms and benefits the construction of communities. From the environmental point of view, developing and adapting the public and food spaces reduces impacts and increases the quality of conditions for bio-types and ecosystems; likewise, through Sustainable drainage systems, rainwater harvesting and sustainable processes can be encouraged. The economic aspect is reflected in reducing economic losses generated with food impacts and the benefits to actors involved. This strategy is combined with the territorial planning instruments of the city and the risk management instruments as the main aim of the integrated water risk management for the city

- This research has demonstrated an opportunity to introduce a new workflow between GIS platforms and Grasshopper, aiming to introduce architectural workflows into urban data analysis.
- The project shows as well a method to combine different types of information sources, such as a Survey (IDECA & Multipurpose Survey), combined with open-source data from the IDECA (Infrastructure de Datos Espaciales para el Distrito Capital) website. This integration also opens the possibility of feeding the research with other sources that could potentially create a real-time workflow.
- The methodology used to define the risk map performs a raster calculation in ArcGIS using environmental and socio-economic data of Bogotá, helping to identify the location of the population to the southeast of Bogotá, where there is a high-risk level. In this way, the Risk map demonstrates how important it is, on the one hand, to communicate the existing physical and socio-economic conditions of a territory easily; on the other hand, it is crucial for decision making where there is a need for mitigation plans and policies development.
- Furthermore, artificial intelligence, in this case, using the K-means algorithm, opens a better understanding of the coverage and distances between different features, which was relevant to understand the deficit, proximity, coverage of urban facilities such as health, cultural and educational. It was more accurate to identify intervention areas on the district scale by combining the risk maps and the K-means cluster methods.
- Finally, the project offers the possibility to the users to manipulate and decide what strategy to implement by observing the deficit values of an area and aiming to bring benefits related to the social, environmental, and economic aspects. This research has demonstrated computational design methods applied to urban scale projects and the ability to perform multiple operations to visualize results in early stages that can inform better future decisions.
Opportunities
- There is an opportunity to introduce an optimization process within the grasshopper environment in order to target specific environmental issues and improve performance at a neighborhood scale.
- It would be as well essential, on the one hand, to consolidate the process into a web server using rhino compute to let users interact and visualize different stages and scenarios. On the other hand, it would open the possibility of developing optimization processes for each of the new scenarios to mitigate specific risks.
- By integrating new Artificial intelligence methods and combining different information sources, it would be possible to develop a loop (Real-time workflow) to visualize results and dynamic urban predictions
