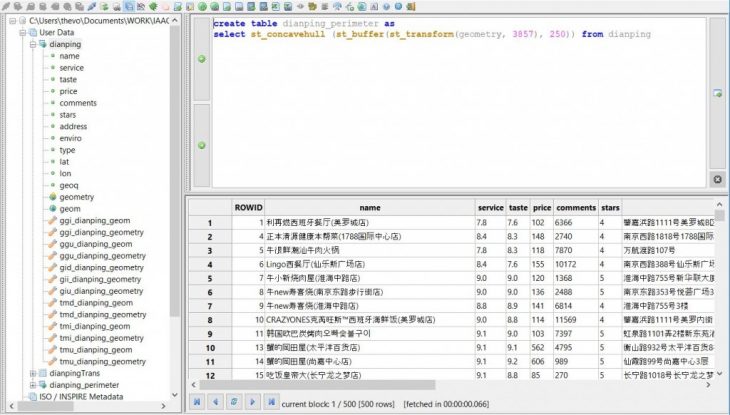
The first half of the Data City seminar was focused on data analysis. Using the specific city of Shanghai, and the specific lens of food, the class first assembled a comprehensive dataset of restaurant locations, prices, reviews, cuisines, opening hours, delivery times, supermarkets, etc. These data were mostly scraped from websites like Dianping or Meituan (which have individual restaurant webpages and review systems like Yelp). These data were compiled and manipulated in Spatialite, using SQL queries.
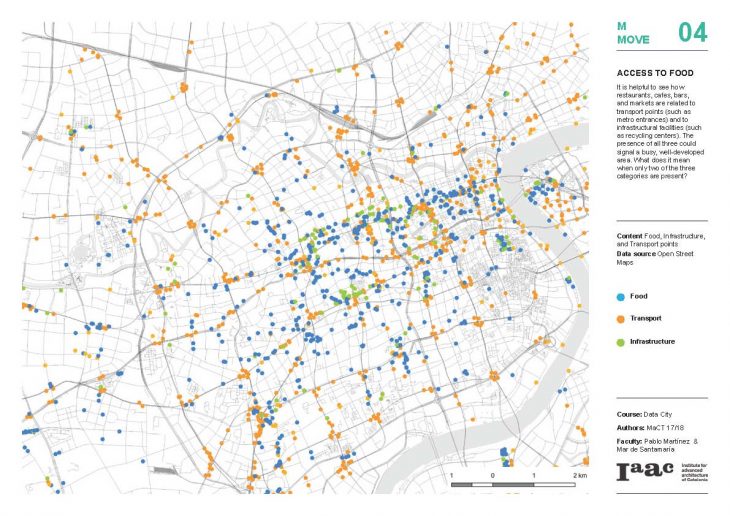
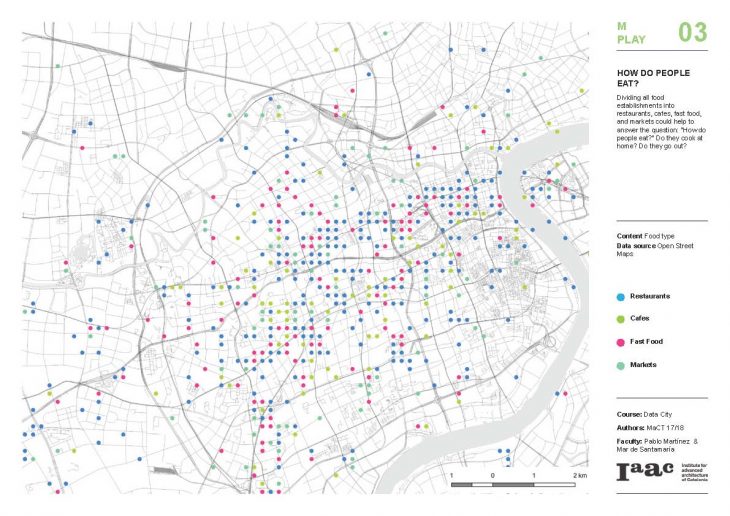
After a series of quick mapping exercises, it became clear that an overlap with other data was necessary to get a better picture of patterns in the city. Food data is rich and interesting, but perhaps we can arrive at some more concrete conclusions by combining and correlating with other datasets. For example, why not use the wealthy amount of data available on transport from Open Street Maps to find out the relationship between how people move and how people eat?
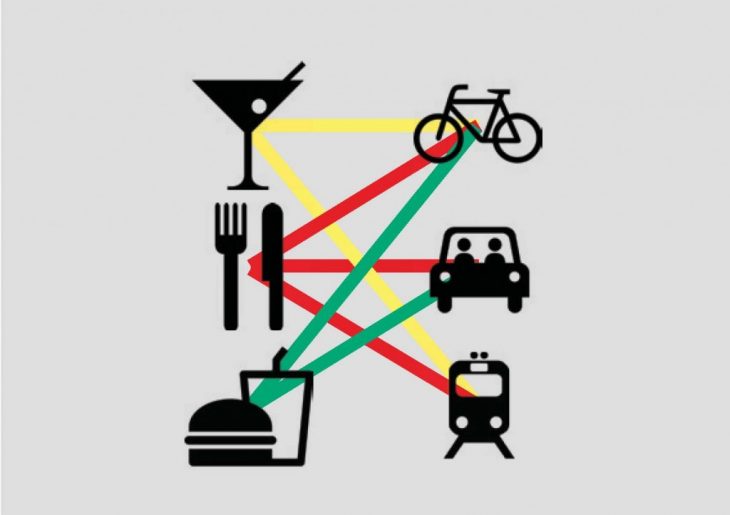
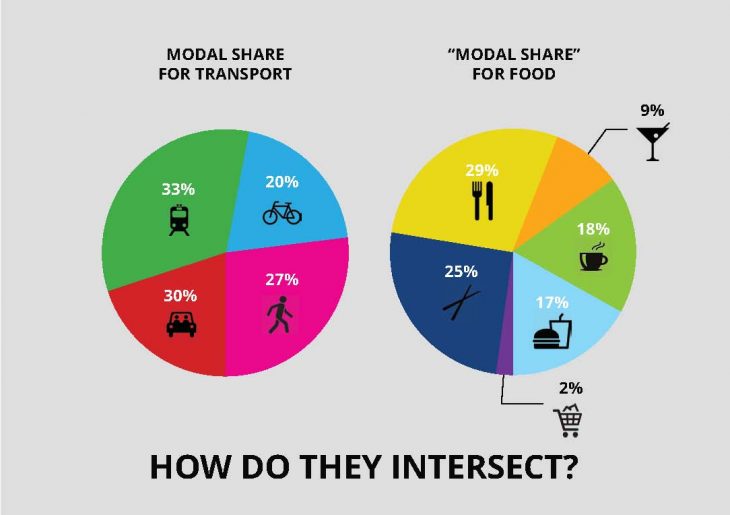
The second half of the seminar focused on developing a data model, then using that model to make a proposal in the city (in any form), then questioning the ability of the model to accept changes and impacts brought on by the proposal. A data model is simply an algorithm that compiles any number of indicators (quantifiable pieces of information) in a particular structure.
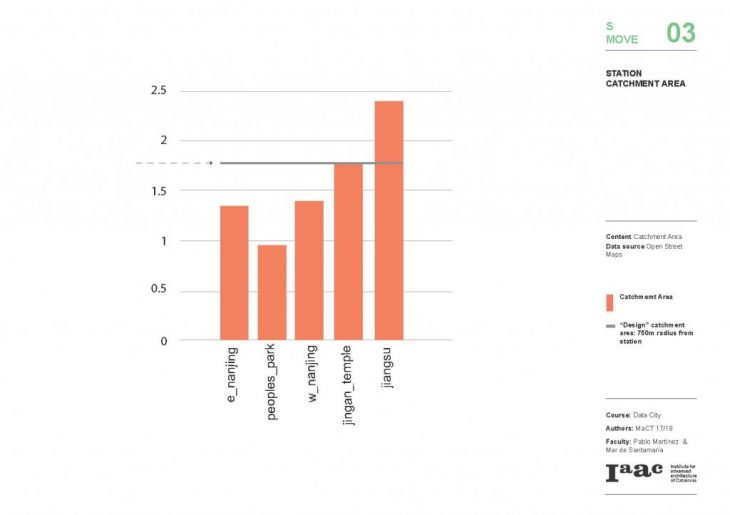
Once the connection between food and mobility was made, the next step was to focus on public transportation because it represents the largest slice of the modal share (9 million trips per day out of 25 million residents). Fortunately, the metro system in Shanghai is well organized, and in its center is laid out on an almost-perfect grid of 1.5km (that is, the average distance, or “design distance” between metro stations is 1.5km). Furthermore, after calculating the number of restaurants that lie within the “service area” or “catchment area” of each metro line, it became obvious that Metro Line 2 is the best connected. Not only does it have the most restaurants within its catchment area, but it also connects Shanghai’s two airports. At its central 5 stations, however, there is expected to be a mix of users: tourists, workers, etc.
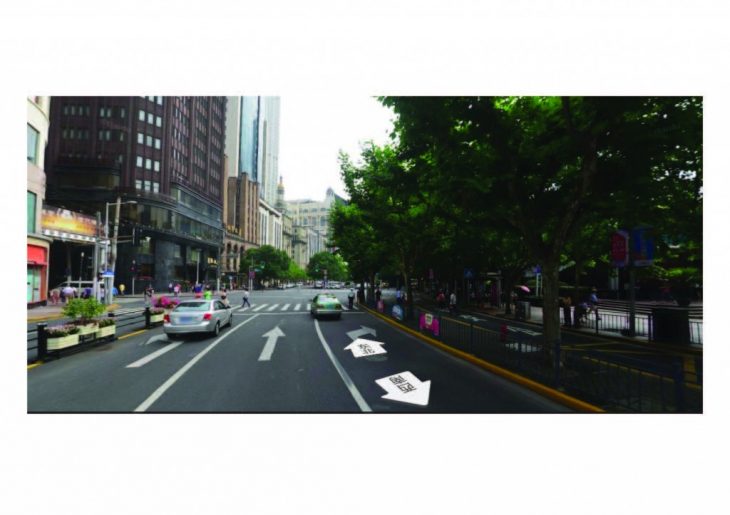
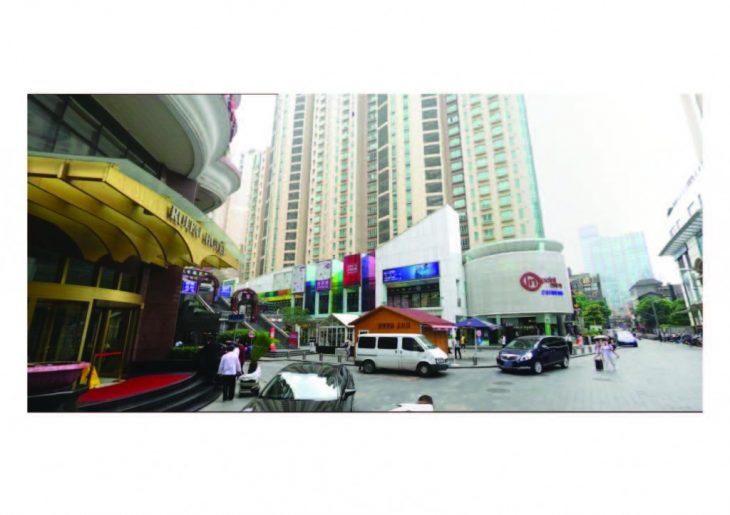
A Voronoi analysis was done to find the more accurate catchment area of each metro station at the center of line 2. Then, with those areas established, one can re-analyze the original food data within those areas to give each metro station its own “food identity.”
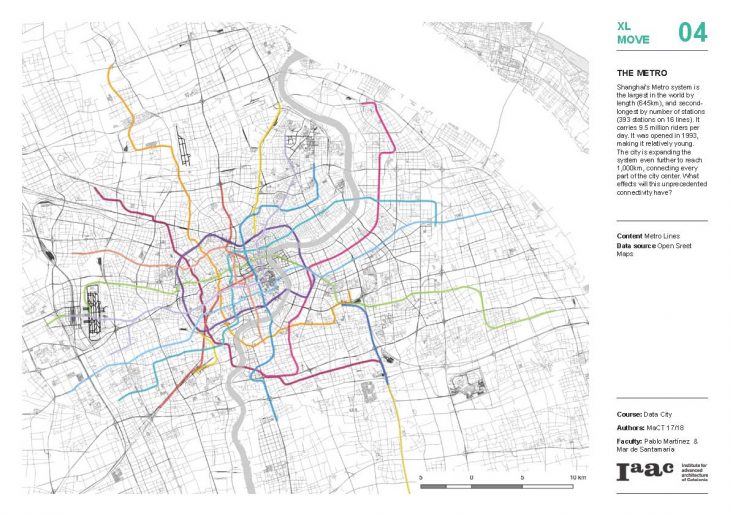
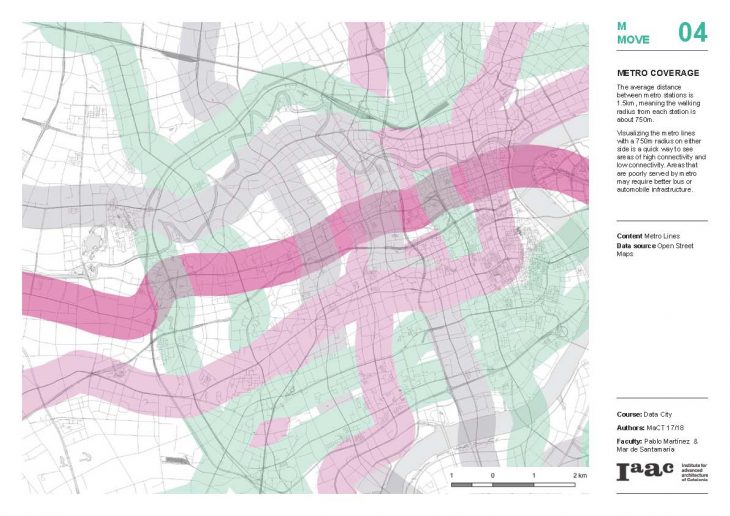
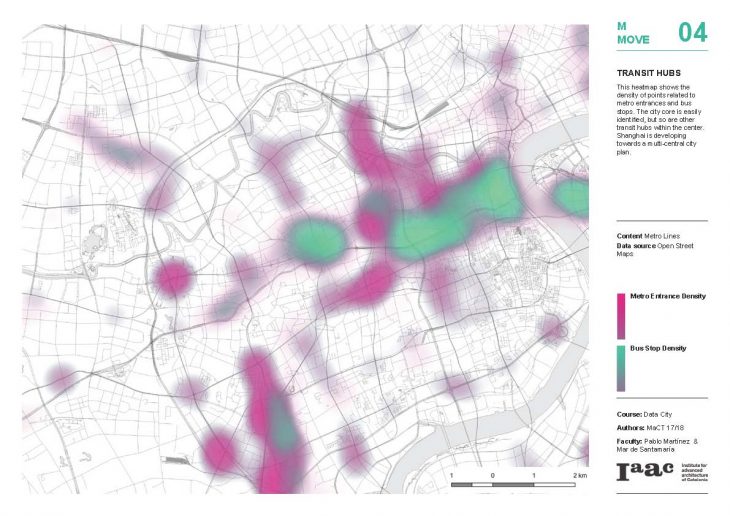
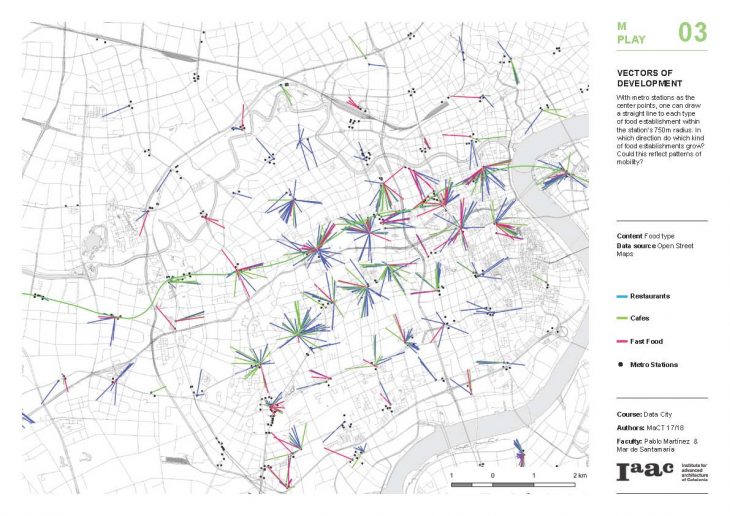
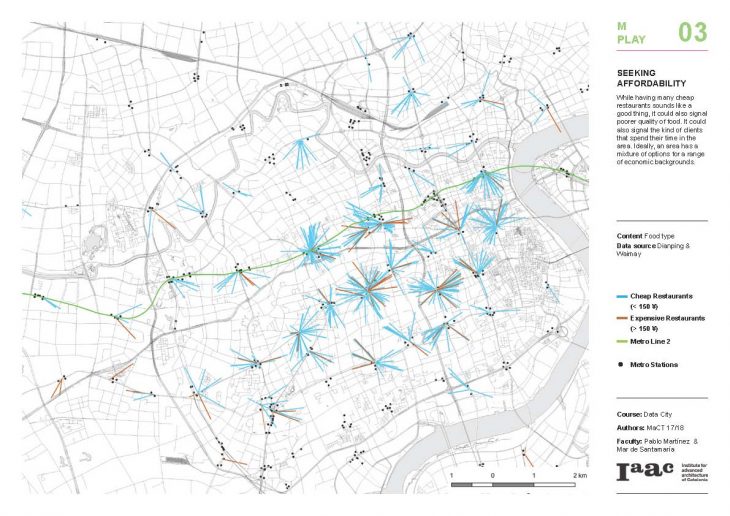
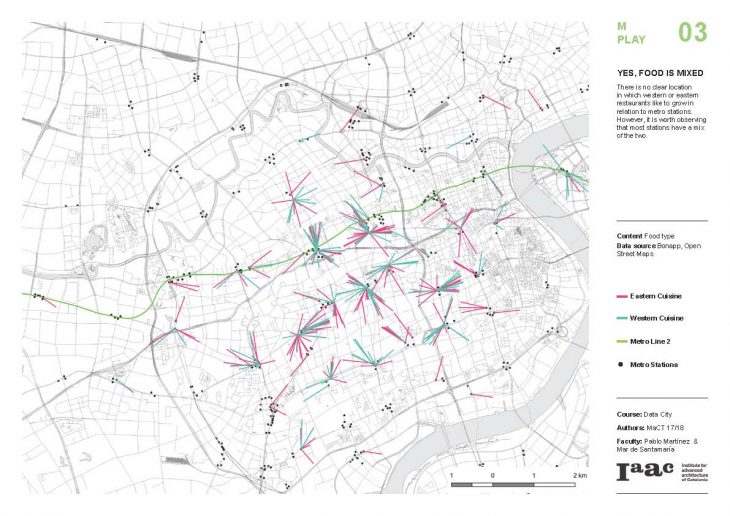
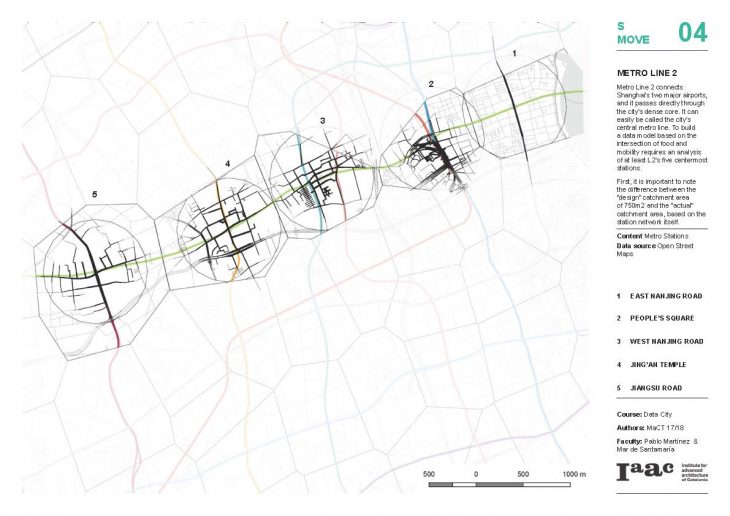
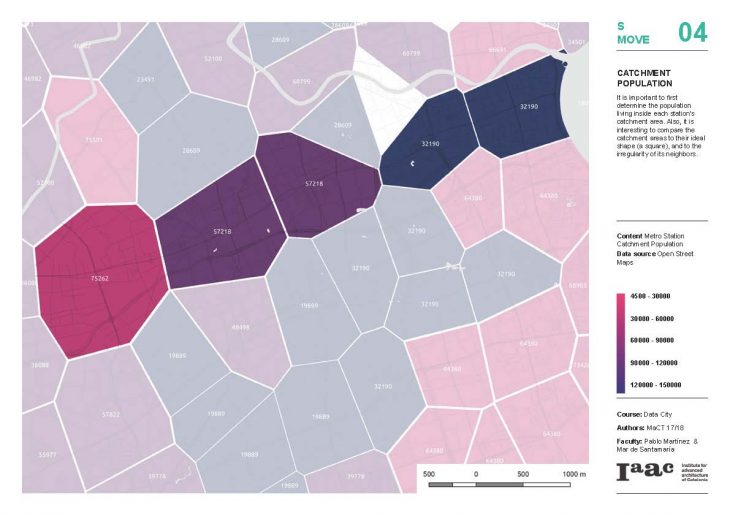
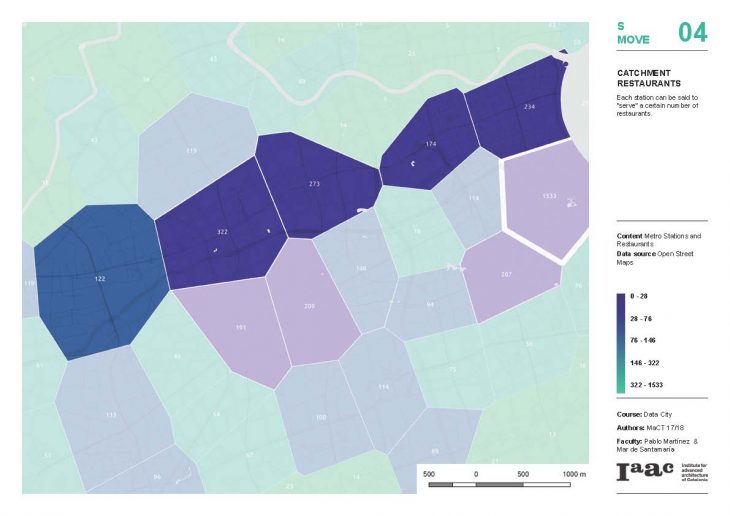
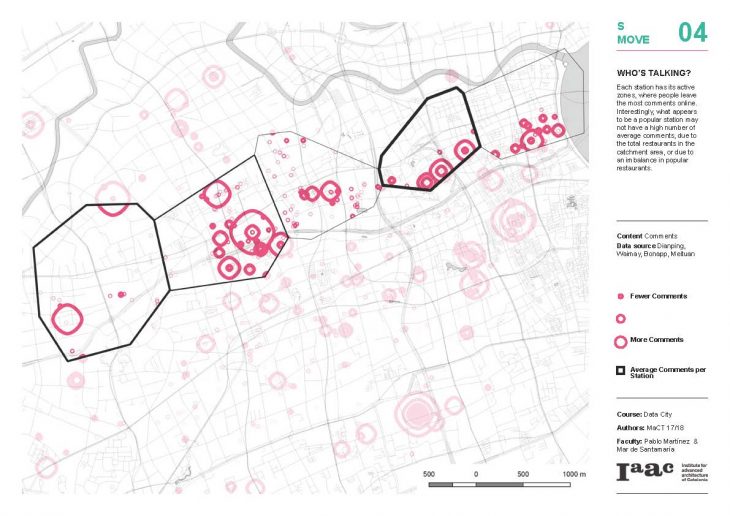
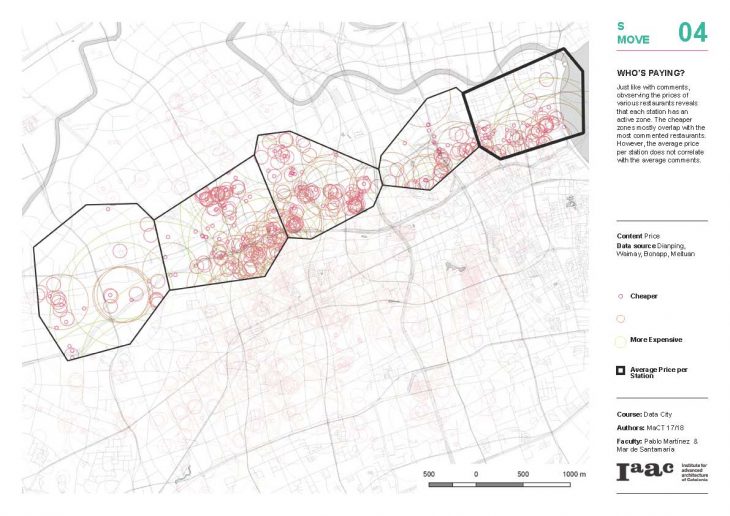
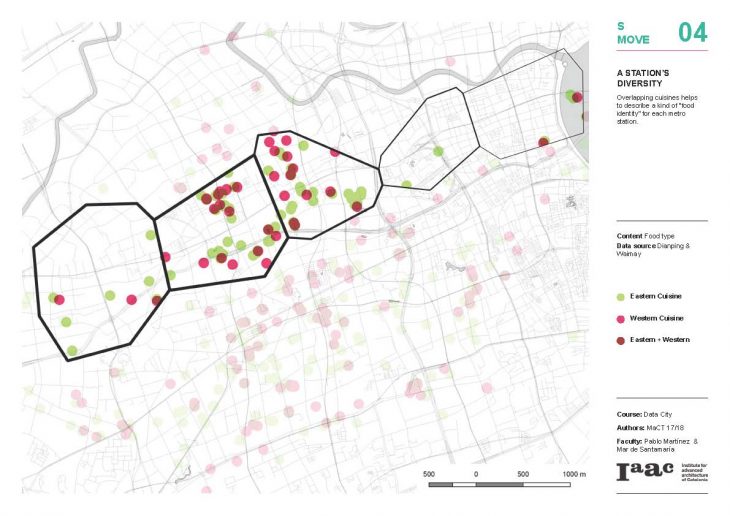
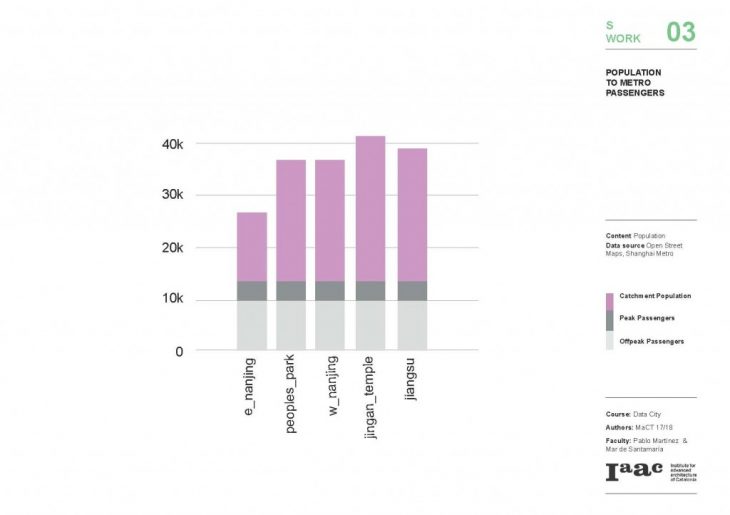
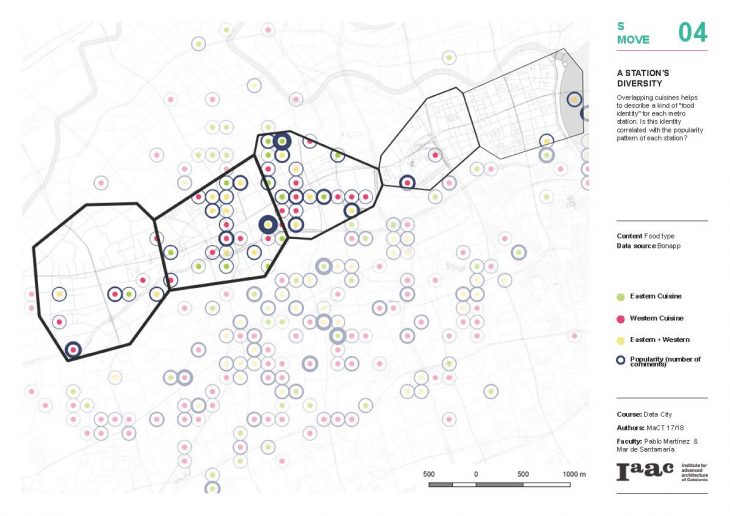 The individual indicators were also charted for each metro station. These basic bar charts and box plots are another method to identify differences across metro stations.
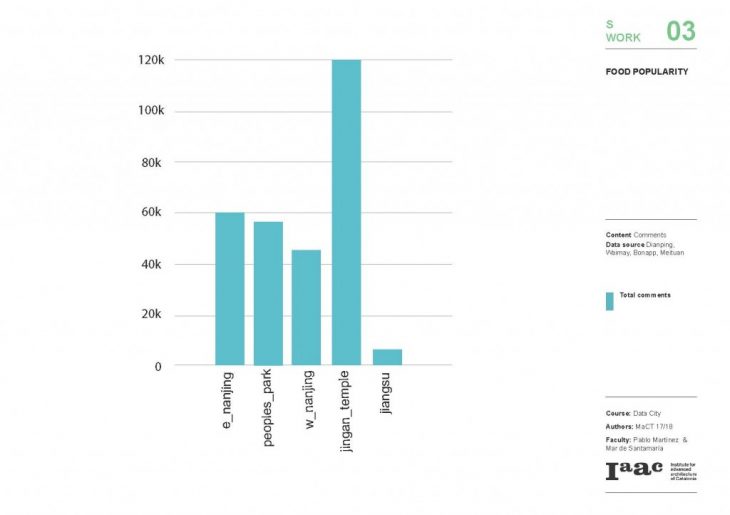
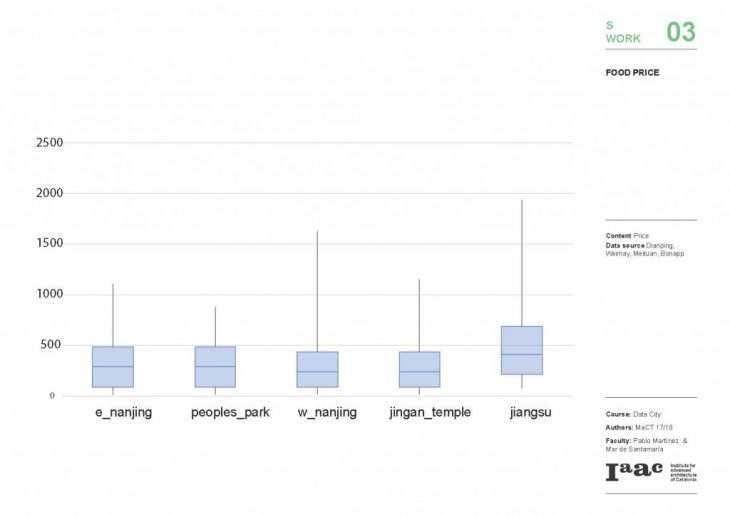
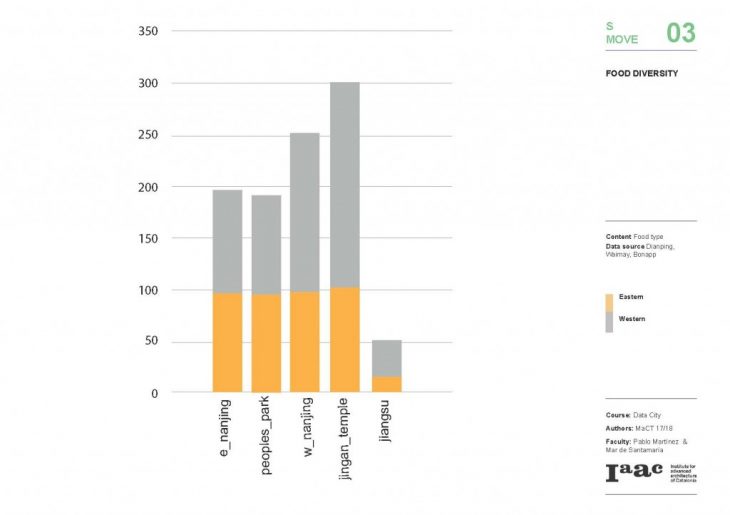
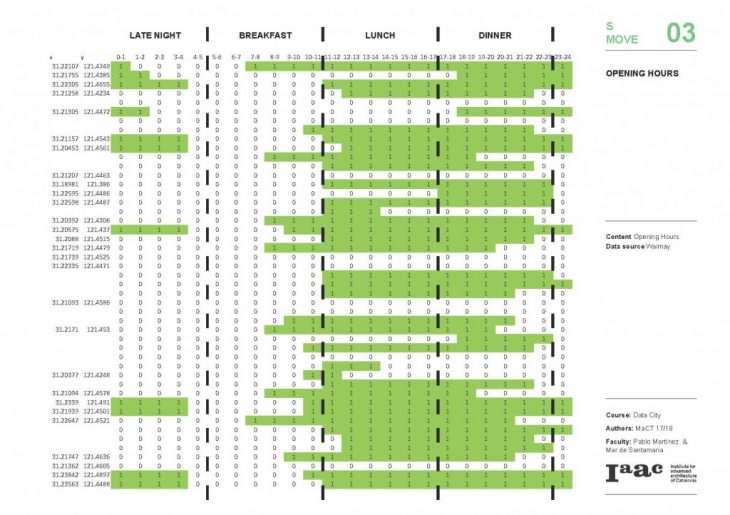
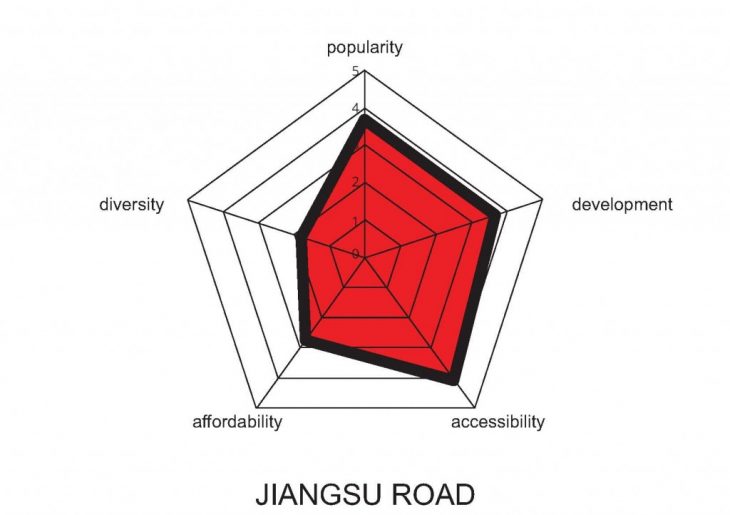
The data model was composed of many indicators, which were grouped into qualitative categories: Affordability, Popularity, Accessibility, Development, and Diversity. Each metro station performed uniquely.
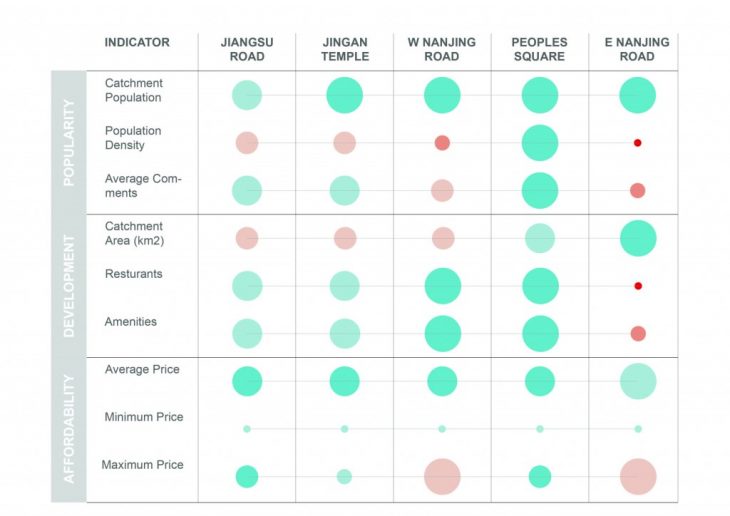
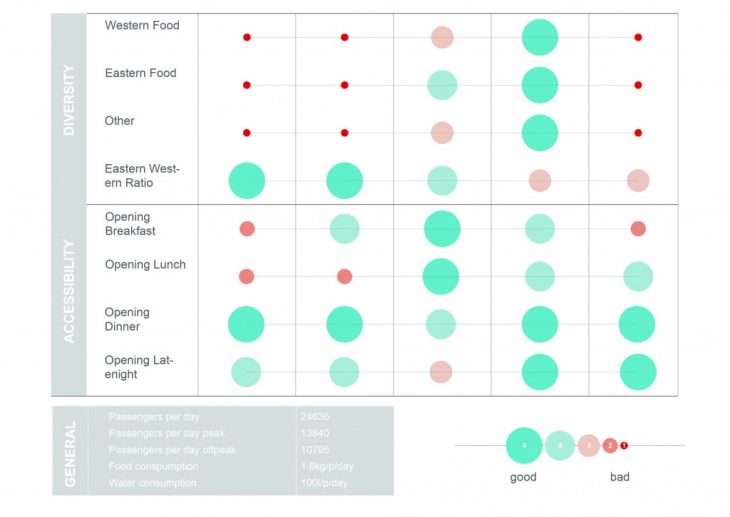
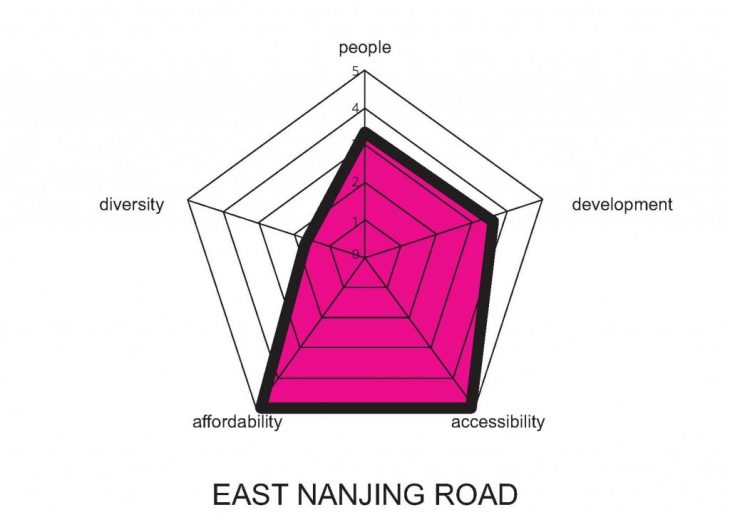
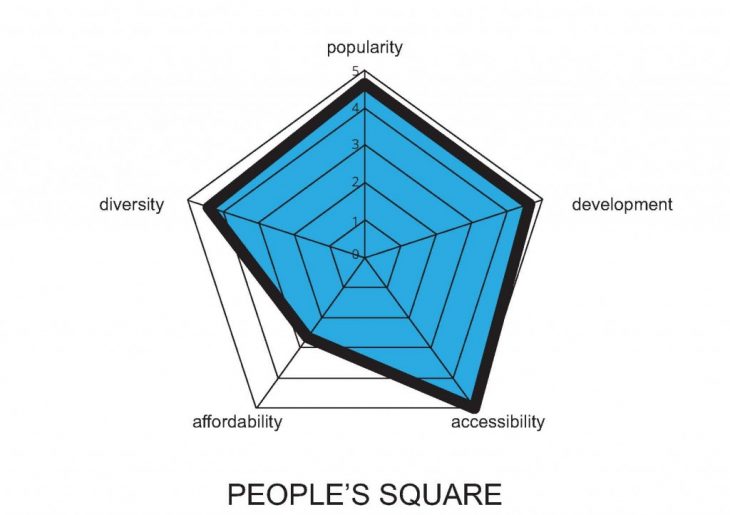
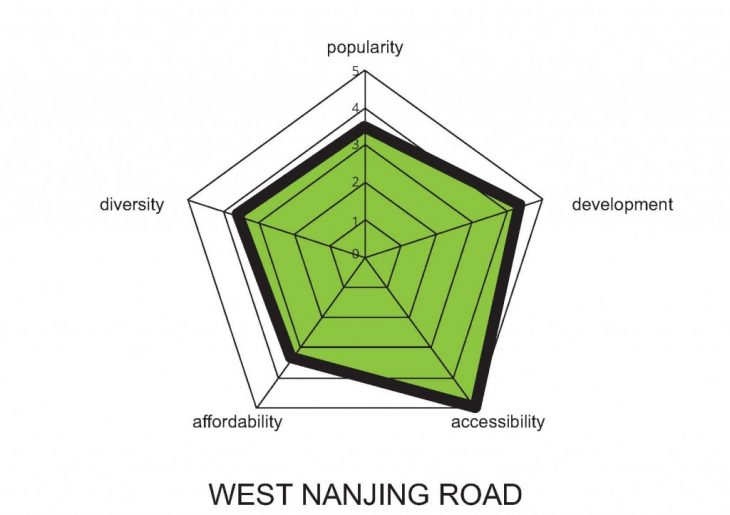
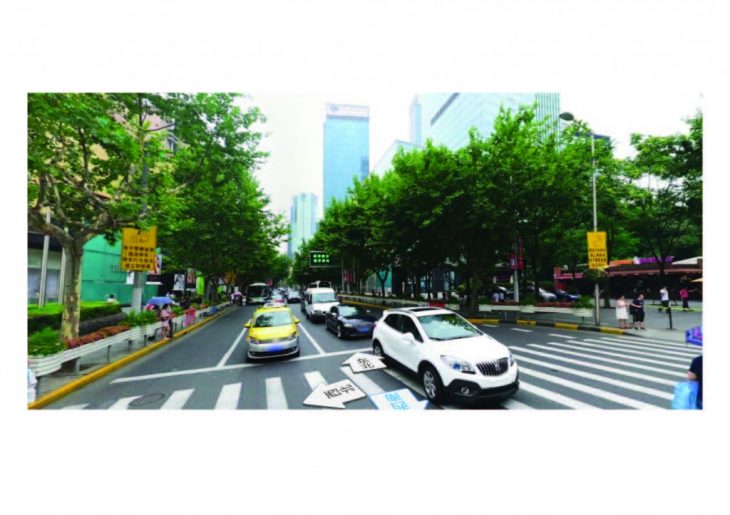
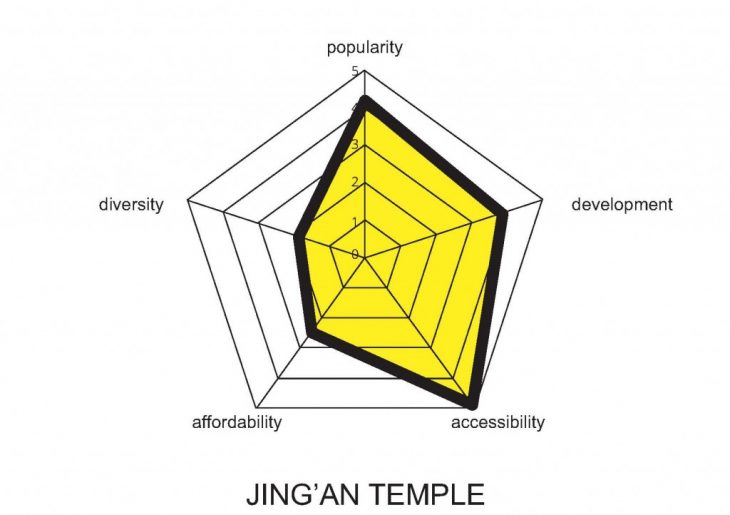
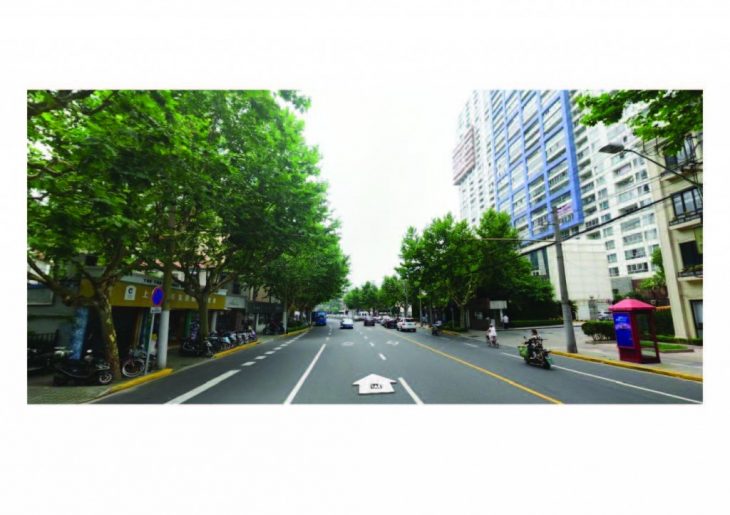
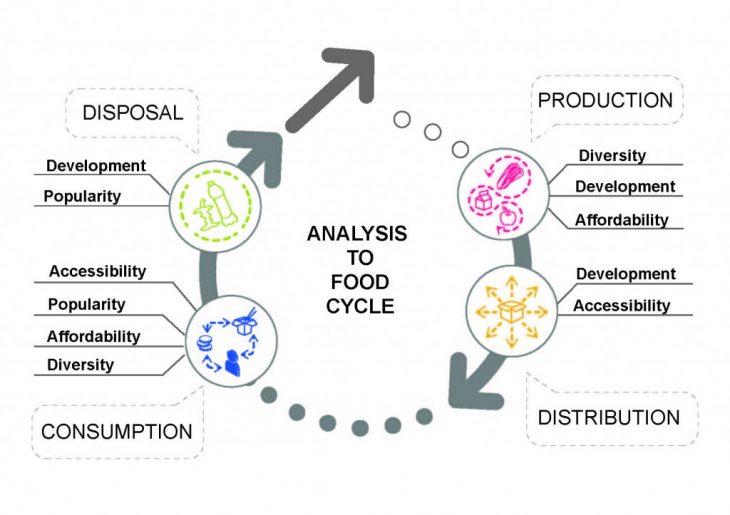
Then, to further develop the data model, each of these five categories was linked to one of the four stages of the Food Cycle: Production, Delivery, Consumption, Disposal. Just like the indicators composed the qualitative categories, the same categories in turn composed the stages of the Food Cycle.
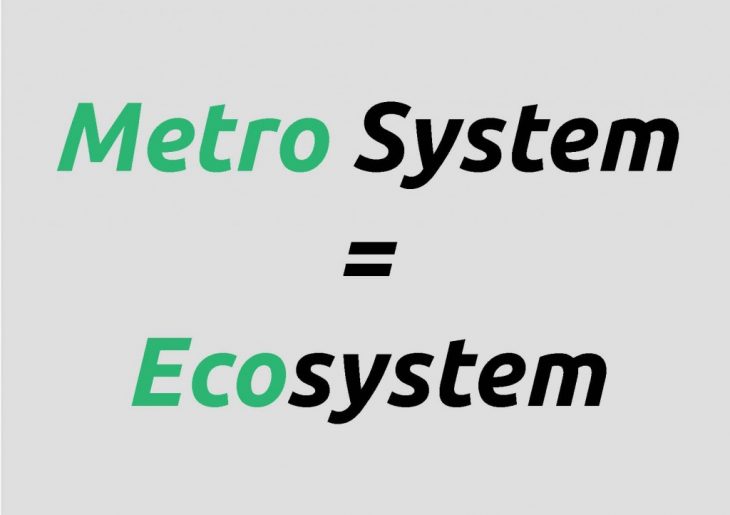
All cities are interested in becoming more self-sufficient. From a food perspective, that means bringing the four stages of the Food Cycle closer together in space. There is a great opportunity to use the enormous infrastructure of the metro system to contribute to and fill gaps within the Food Cycle. If we imagine the Metro System as an ecosystem, we can fuse mobility and food.
 As a proposal, each of the 5 metro stations at the center of the city becomes a specialist (such as “producers” or “recyclers”) and is able to satisfy a need that an adjacent station might have. Food can be exchanged on the metro, or a metro station can become a production facility, or the tunnels could be used to dispose of waste during metro closing hours.
A number of modules were designed which address each specific stage of the Food Cycle, and metro stations can adapt any combination of the modules in order to bring out their specialization.
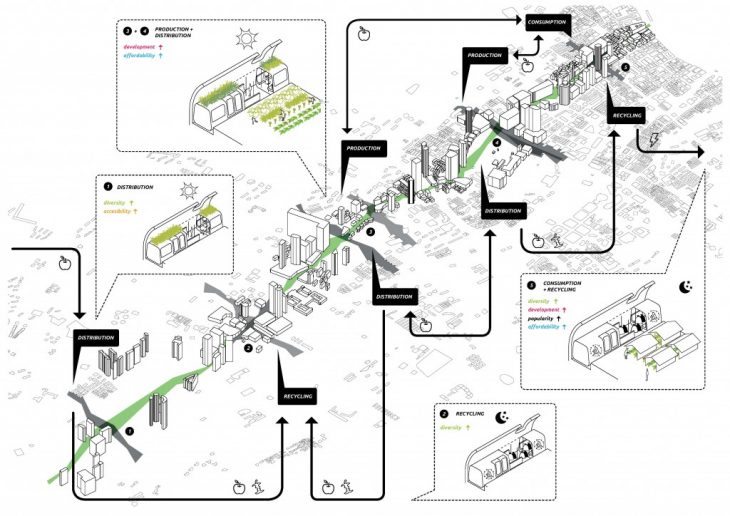
Ultimately, this model would be applied to the entire Metro system as a whole, in order to identify if a station at one end of the city could pick up extra food supply in another end of the city, or if a train carrying a garden on its roof could be rerouted to another line to make a delivery. The patterns of motion and the patterns of food consumption thus become more intertwined.
ProMetro is a project of IAAC, Institute for Advanced Architecture of Catalonia, developed at MaCT (Master in City & Technology),
2017-18 by:
Students: Ivan Himanen, Irene Rodriguez Vara, Venessa Williams
Faculty: Pablo Martinez, Mar Santamaria