The Quality & Quantity of Dataset for Improvement of Geometry Prediction
Introduction
Our project consists of the exploration and comparison of different machine learning methodologies applied to an architectural problem: the basic house design and analysis.
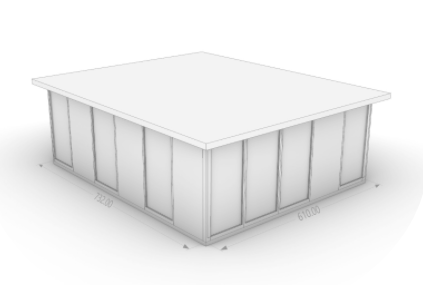
The house typology chosen has a SIP construction system – Structural Insulated Panels made of wood. The house changes sizes increasing or decreasing within the dimensions of a regular panel size (width: 1.22m, height: 2.44m).
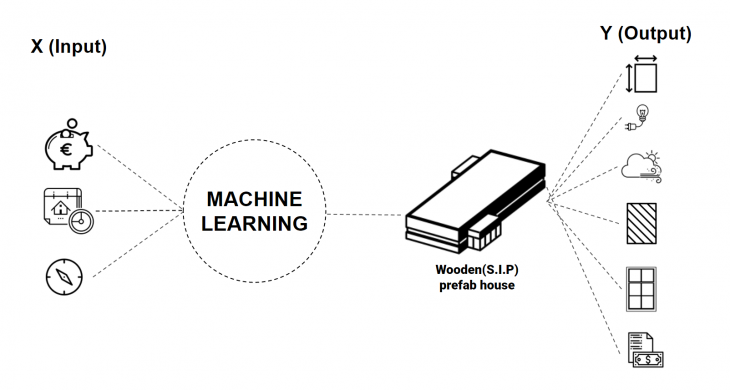
Based on this simple geometry, we developed a Grasshopper script to generate a representative population, and encode a dataset of its dimensions, orientation, construction cost, construction time, brief annual energy consumption and daylight, either calculated from online construction reports, or simulated with Honeybee/Ladybug (considering the surroundings of Paris as location).
We expect that a machine learning model can quickly predict a house that fits the user’s inputs of cost, time and orientation, serving as a better informed start point for designing a simple house.
The conclusions show that dataset quality, relationship between the inputs and outputs and correctness of ML model structure have to be carefully considered in order to achieve better results. Also, the importance of carefully choosing an appropriate question for a Machine Learning algorithm, that suits the available or creatable dataset while also making sense to try to predict from the point of view of the user.
Problem Statement and Workflow

The difference between the conventional design process, and this ML empowered methodology would be the starting point and the speed on achieving the first results. Our model would allow for an informed first guess. Faster analises, starting from the information that don’t usually change – like the terrain, and the desired budget
In general computational process, a client meets an architect to consult a house, then, this architect does some environmental analysis and calculation to design and build. In particular, environmental performance simulation takes a long time to calculate for each design alternative. Our idea has started from the question below: what if user have can get a house design plus other important beginning information from their cost and time? We believe that the Machine learning can accelerate the computational process. Then user will get real-time feedback experience to choose their design.
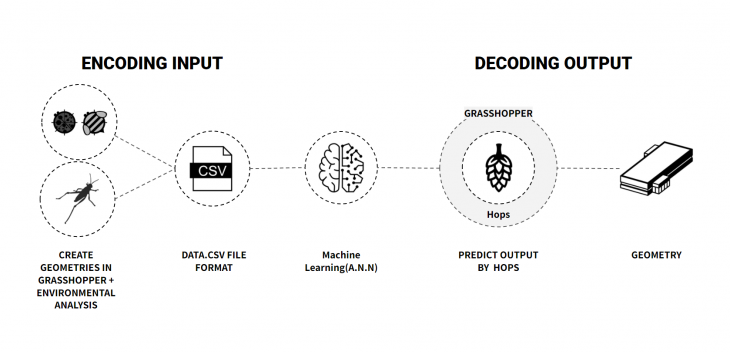
As teached through the seminar, we encoded geometric data, generated in Grasshopper, as a csv file with all samples we considered necessary, or were able to generate through time, added this to a training ML environment – in this case the Colab – trained a few alternatives, saved the models as h5 files, and deployed it back to grasshopper through Hops component and some Python codes – in this case running in Visual Studio Code – to get back the predicted geometry.
Machine Learning Structure – INPUTS and OUTPUTS
Generation of the data set
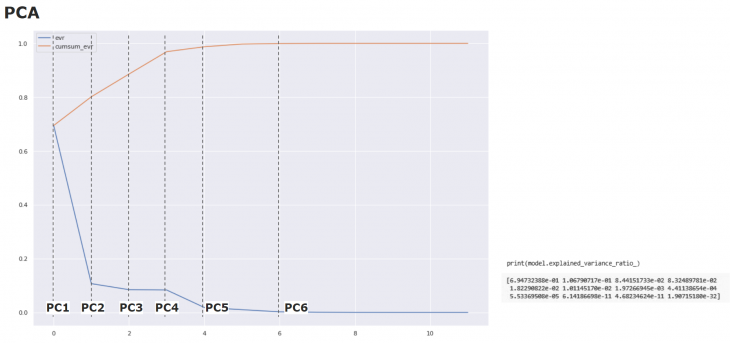
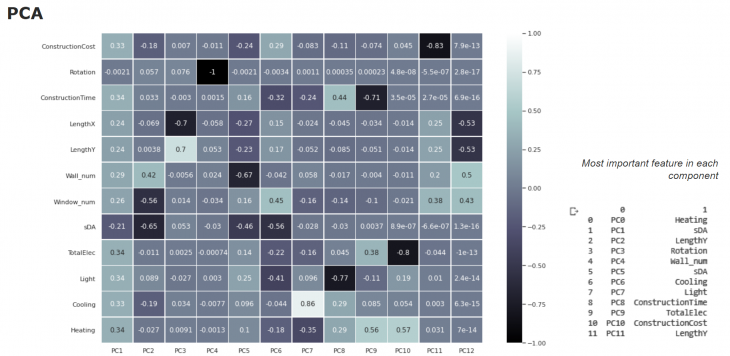
The PCA (Principal Component Analysis) evidence the the importance of the environmental information, as Heating and sDA.
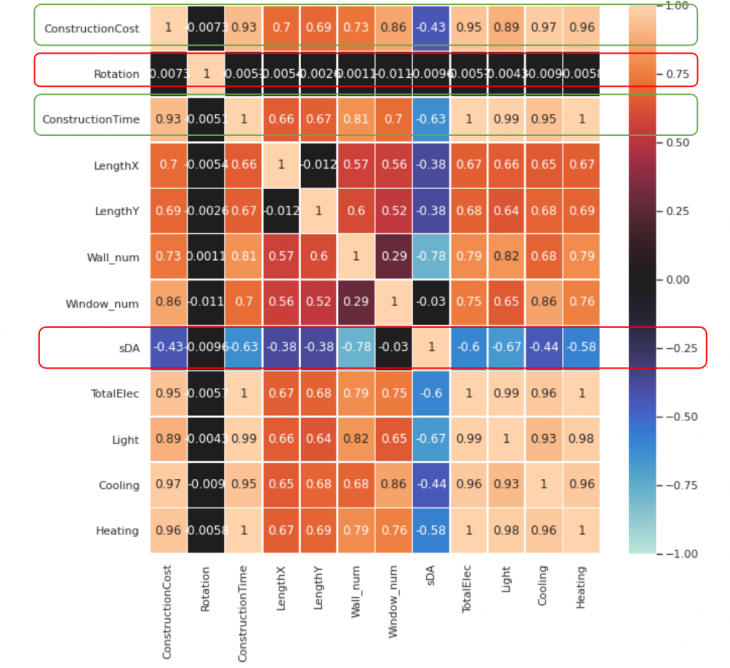
The Heatmap evidence the difficulty in relating the parameters of the database. And also, points out the difficulty of the model in understanding the contribution of rotation to the predicted values.
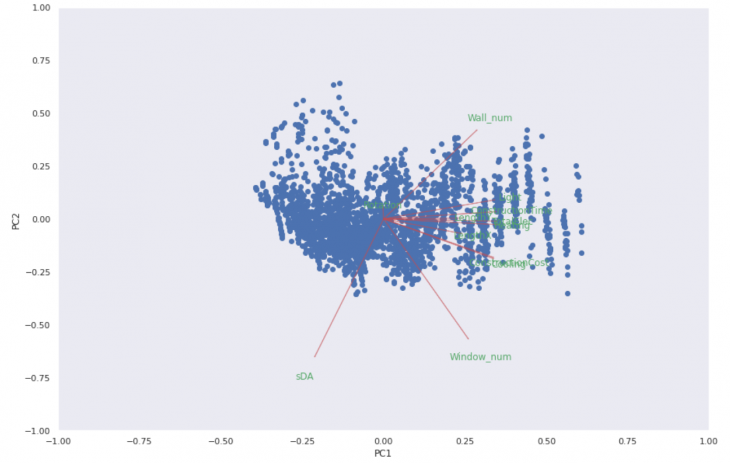
In one of the PCAs Scatter Plot we can see the small line for the Rotation parameter, indicating its low contribuition and relashionship. In these kind of plots, the length of the arrow represents how much that variable explains the variance of the data. A small angle indicates that the representation of the two variable are positively correlated. And angle of 90 degrees indicates no correlation. An angle of 180 degrees indicates a negative correlation.
Model comparison
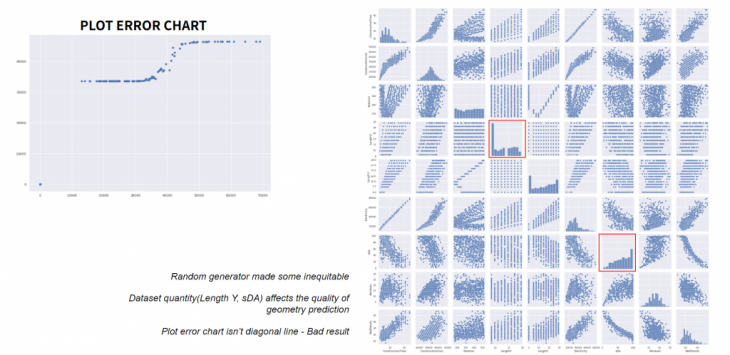
Model 1 plot error and data set panel showing the possible cause of the bad results were in the malfunctioning of the random component generating the geometry on GH.
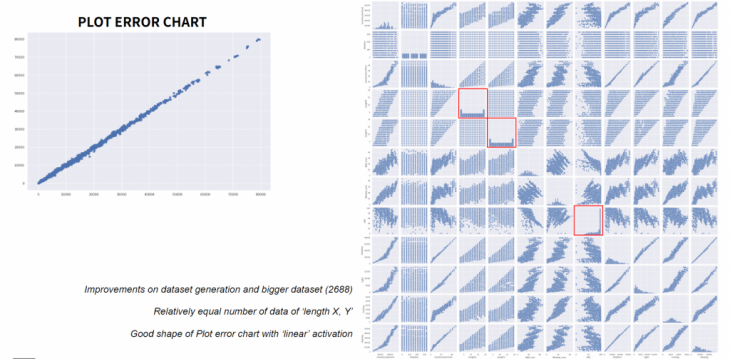
Model 2 plot error and data set panel showing better results, after correction of the generated data.

Model 1 we trained 662 samples, with a sigmoid activion, and 4 dense layers. Model 2, we increased to 2600 samples, with than a liner activation. Model 3, we added 2 dense layers to the old one.
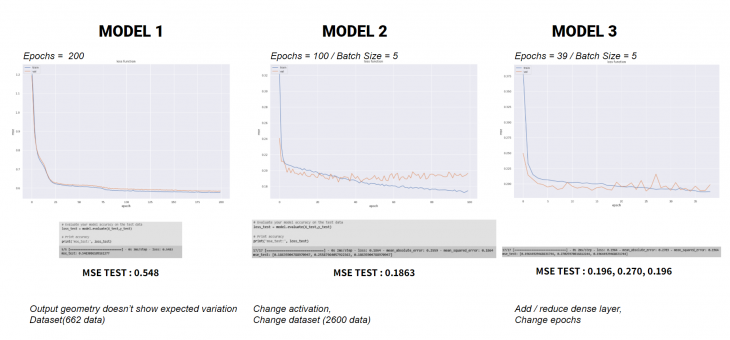
The loss function plot of each model shows that our ML overfits around the 40 epochs. The Model 1 had a higher Mean Square Error – while also it did not predict good geometry – what we will show later. Model 2 has better mean square error, but shows overfitting. Model 3, with less epochs, has basic same mean square error, but predicts closer numbers to the ones trained.
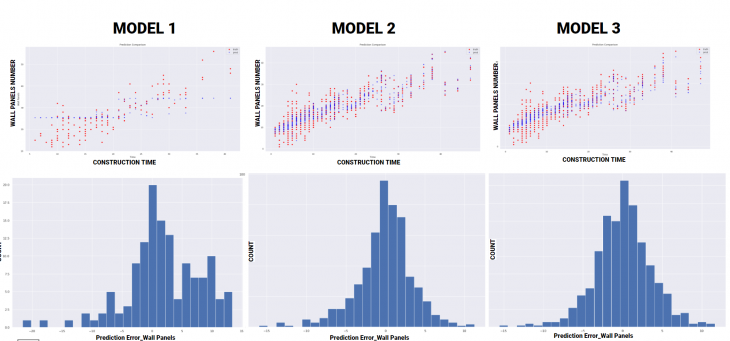
PREDICTION COMPARAISON : Construction Time / Wall panels numbers
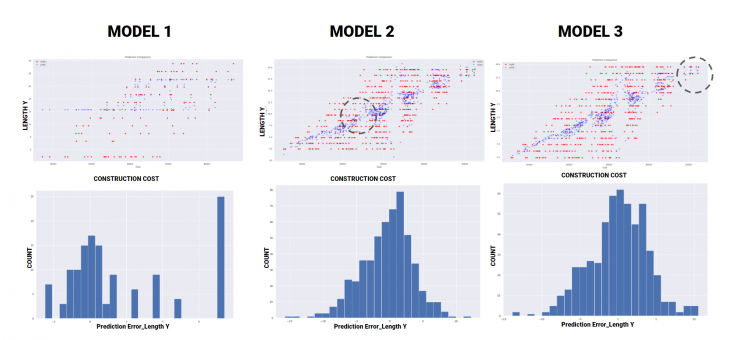
PREDICTION COMPARAISON : Construction Cost / Length Y
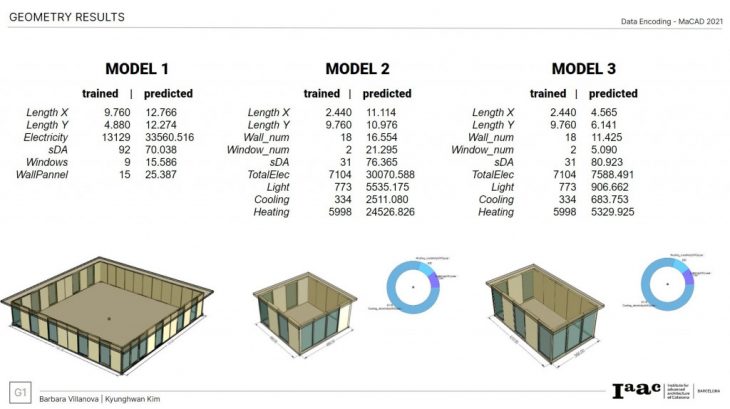
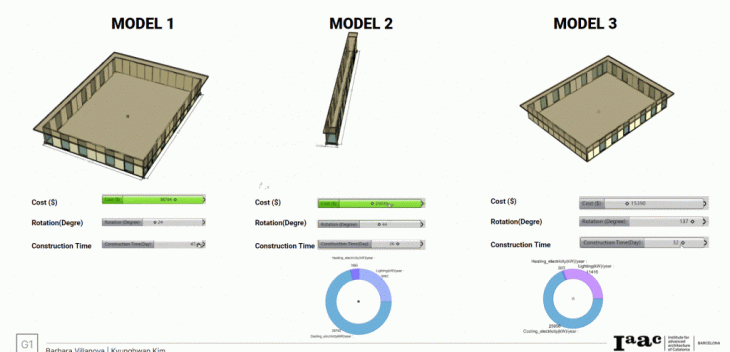
Geometry results after predicted data decodification in Grasshopper
Conclusions
Because of the complexity itself of Machine learning, we chose a very basic house design to test and understand errors. This project has a capacity to develop with more complex form architectures in near future.
Through various experiments along side the ones here presented we could notice only a slight variation in the geometric results obtained while changing the model architecture by adding or reducing hidden layers in the neural network. Whereas, the variation in the number of epochs and batch sizes intensely affected the geometric result obtained.
In our project, the predicted values in output are directly related to the size of the house, thermal data and energy consumption. In the final test result, these values were a little higher than the trained values, although our model has a good MSE(mean loss error). We conclude that this situation occurs due to the large number of irregular samples generated from the random facade. For deeper development on the subject of this research, it is necessary that the dataset creation evolves in a direction of greater accuracy and clearer relationship, in order to enable the necessary feature correlation by the machine learning algorithm.